by
The study of the surface of the Earth, Topography, reveals all sorts of different shapes and patterns. When these patterns repeat we get insights into hidden features of the planet. For instance the size, range and placement of mountain ranges or volcanic island chains advancing knowledge of plate tectonics. In much the same way the repetition of patterns of price in the markets can reveal similar insights. Reviewing the charts of the Select Sector SPDR Funds shows several distinct patterns this week. Knowing how they have played out in the past gives insights to what to look for going forward. Let’s take a look.
The Bull Flag
The Energy Select Sector SPDR, $XLE has broken higher out of a 3 month Bull Flag. Like an area of weakness on a mountainside that has eroded away the flag shows minor weakness in what is clearly an uptrend. Often these break outs retest the break point and from the chart below you can see this one has and is now moving higher. Like many continuation Bull Flags the break out higher is
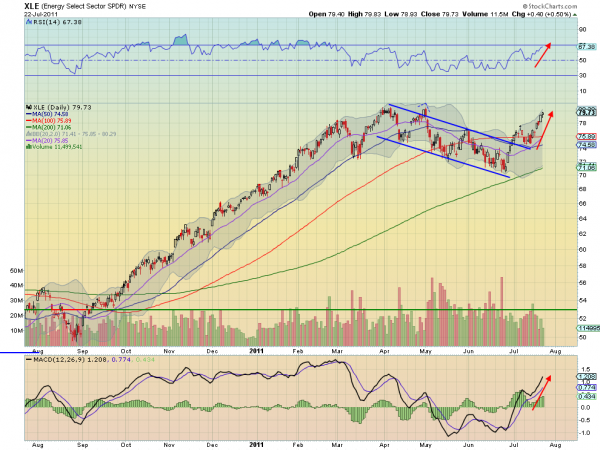
supported by a rising Relative Strength Index (RSI) and an increasing Moving Average Convergence Divergence (MACD) indicator. Note how on the major leg up the price remained above the 20 day Simple Moving Average (SMA) but fell below it during the flag. As it breaks higher it is back above the 20 day SMA. The next move for the $XLE is to resistance at the 80 area and then a Measured Move (MM) from the initial leg higher to a target of 100.
Higher Highs and Higher Lows
Sometimes looking far off into the distance you can see a series of rolling foothills heading higher into the mountains. Each peak and valley is a bit higher than the last as the path continues higher. This same pattern shows up in two sector charts, the Utilities Select Sector SPDR, $XLU and Consumer Discretionary Select Sector SPDR, $XLY. Looking below at the chart of
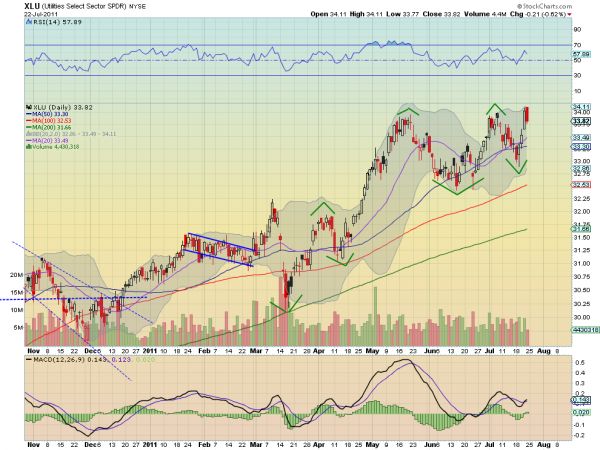
$XLU shows the series of green tops and bottoms rising as it moves through time. Note that the RSI has spent the majority of its time in bullish territory over the mid line during this dance higher. The candle from Friday, a Dark Cloud Cover, may signal another higher top in the series if it confirms Monday, but eh trend remains higher until a new lower low is created. The $XLY is still heading towards a new high with a supportive RSI and MACD.
Triple Tops
When you get high enough and deep enough into the mountains all of the peaks start to look to be about the same height. Still at lofty levels but no longer running higher. This happens with price action as well in a triple top, as seen in the charts of the Materials Select Sector SPDR, $XLB, Industrials Select Sector SPDR, $XLI, and the Technology Select Sector SPDR, $XLK. From the chart of $XLK below notice that it
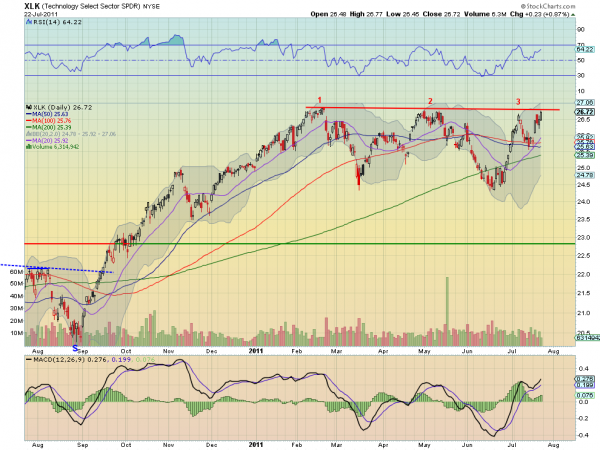
is now approaching a fourth time, but from a higher low and with a RSI that is rising and not yet overbought and a MACD that is growing and not yet losing slope. Unlike the mountains it does not mean that the only future direction is down. It stands a good chance of breaking through the the triple top this time. If it is successful then a new target of 29.50 is established on the MM out of the channel from 24.50 to 27. Failure does not threaten to turn into a downturn unless it then falls under 24.50. The $XLB is similar with the channel between 36 and 41 and break higher establishing a target of 46, and $XLI with a channel between 35 and 38.50 leading to a target higher at 41.
Symmetrical Triangles
The closest proxy for a symmetrical triangle in Topography would be a cliff face jutting out. It is pointy but through time erosion flattens the point, making the place where a drop from the precipice closer to the base, where the material is stronger. In the charts this the move out of a triangle is rarely at the apex and said to be strongest at the 2/3 point. Three sector charts fit this category heading to ward the apex and getting in the action zone. They are the Consumer Staples Select Sector SPDR, $XLP and the Health Care Select Sector SPDR, $XLV. Using the $XLP to demonstrate, you can see a fourth touch of the
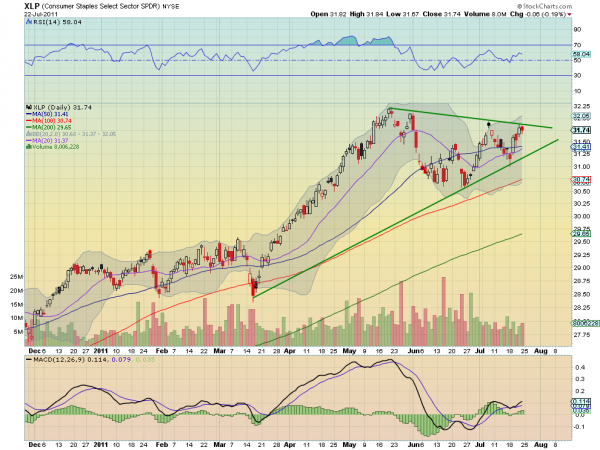
top rail approaching after two touches to the bottom rail, which is an extension of trend support back to mid March. Unlike a cliff face, price can also break out higher. A break above the top rail at 31.90 would establish a target of 34.30 out of the pattern, and it has support of the rising RSI and increasing MACD. The $XLV is identical with a break above 36 establishing a target of 39.50.
Double Bottom
Like the ruts of two canyon channels seen from space a Double Bottom shows the lowest point where ancient waterways carved the floor of a river. And like the Grand Canyon, this does not have to be at a relatively low elevation. The chart of the Financials Select Sector SPDR, $XLF is showing a potential double bottom at 14.60 as see in the chart below. Rising out of that
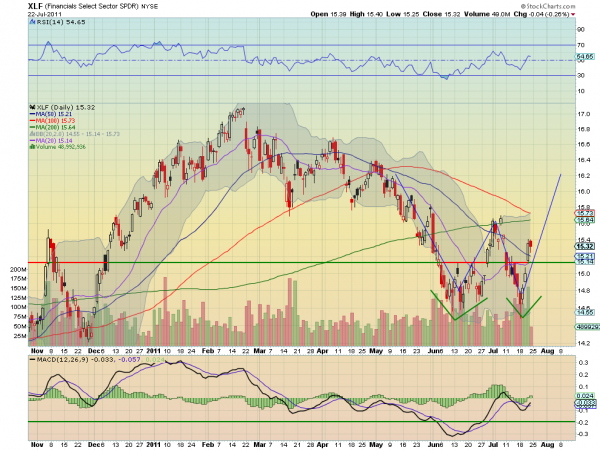
bottom now it has some promise for a move higher with resistance at 15.70 and above that the target for a ‘W’ pattern at 16.40. The MACD is crossed positive and the RSI is rising as it attempts higher. Financials have not been participating in the market move higher is this a sign of a change after our journey into the mountains and falling from the cliffs that the new bottom is in?
No comments:
Post a Comment