By Harlan Pyan
The following is an excerpt from today’s premium report by All About Trends. Enjoy a free 15 day trial to their service and receive daily stock picks, market analysis, and a complete trading plan.
Use trend channels, lateral supports and the 50-day average to define your risk.
We talk all the time about 3 common support zones around here:
1. Trend channels when they apply and usually are annotated on the charts in green
2. Lateral support zone and usually are annotated on the charts in blue
3. And typically the 50 day average.
All of these define risk. Here’s what we mean by that.
Take Blackrock- BLK for example.
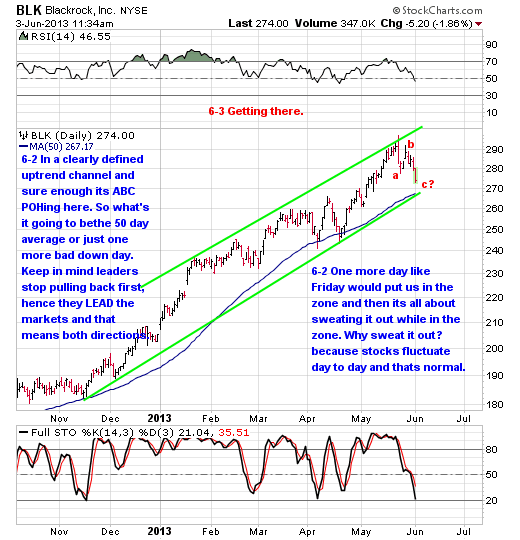
We see trend channel support in the green line very clearly. As long as the stock is within those green trend lines its overall trend is up.
So let’s say you had a weak emotional moment and chased a bus with it at say $290.
Look at that level and look at the overall trend of the stock. See it? The overall uptrend as defined by the green trend channel is up.
So what’s the problem? Nothing really if you think about it. You are long a stock in an overall uptrend it’s just that it’s pulled back within that overall uptrend below your entry point.
Now let’s say you bought in the face of fear when it and the indexes were down on Monday. What’s the problem here? Nothing really it’s still within an overall uptrend that has pulled back off of uptrend high.
What’s the difference between the two entries? One is you bought near trend channel resistance the other nearer to trend channel support. It’s all about risk definement and managing that risk.
What’s our risk right here then? Well it comes down to trend channel support. What percent is that away from our entry? It’s 2.5%, big deal right?
What if it breaks trend channel support after we buy it and are down in it?
We stop out as the uptrend pattern is no more. BUT before we do that we need to see where a prior support level is in blue or where the 50 day average is because if they are near we may want to hang in to them. In this case the 50 day also just happens to be trend channel support.
Remember supports are floors where stabilization can easily take place and an uptrend can get defended. Our point being just because a stock breaks one type of support doesn’t mean it’s toast you know. Just look at the April lows in the NASDAQ Comp. for that.

The NADSAQ broke trend channel support BUT it stopped at a blue line support just below it. And the rest was history away we went. So if you automatically stopped out it was premature.
What’s the moral of this exercise? Before you take any trade look at a chart and ask yourself, IF you were to be buying it right here what’s your risk percentage wise in the event it were to go to the green line or the blue line or the 50-day average.
This is why we say knowing where supports are helps define ones risk. It also smooths out the volatility folks.
Let’s take it a step further and add a new element that ought to really drive it home which is trade size risk management to the mix.
We try to stick to 5-7% per position when we do a trade AS A GUIDE. When you combine that with everything above you see that the risk to the overall portfolio goes down immensely.
On its own trade size risk management is the saving grace for when a stock goes against you. You see when properly employed on its own you can take a 20% whack on a stock and say with a 5% position the total impact to the overall portfolio is one measly percent.
When you use it in tandem with using trend channels, lateral supports and the 50 day average the risk is even more diminished per trade baring an unforeseen news driven event in after hours over which you have no control over anyway.
So you see? We have multiple layers of risk management per position and per the overall portfolio.
Now let’s apply that to BLK and a portfolio of $100,000:
BLK

From here ($278.33):
To trend channel support is 4%, using 5% of the overall portfolio is 2/10ths of 1 measly % impact to the whole.
To the 50 day average is 4%, using 5% of the overall portfolio is 2/10ths of 1 measly % impact to the whole.
To the blue support line is 6.5%, using 5% of the overall portfolio is 2/10ths of 1% impact
In Summary:
We’ve laid out the risk percentage wise based upon the green uptrend channel, the blue lateral support zones and the 50 day average. Keep in mind that those are also levels where support and stabilization can occur so upon a tag of them it doesn’t mean that you automatically stop out of them. If stabilization at those levels occur and you stopped out? You’ll wish you didn’t.
We added the trade size risk management element to each as well based upon 5% positions.
By doing so, we’ve defined risk two ways visually and we’ve also smoothed out the volatility which in turn smooths out the emotional state as well.
When you look at the percentages as shown you can clearly see there never really is anything to worry about from this point forward when it comes to taking on positions when stocks fluctuate (and let’s face it ALL stocks fluctuate) and go below your purchase price as we’ve just framed the risks and the overall portfolio risk.
That goes a long way to towards managing ones mental stress and state.
In the end you’ll either make a gain, a wash or a loss as it can be no other way. BUT no matter what you have to be willing to take the risk. We hope we’ve been able to lay out how to define and manage that risk with multiple layers.
No comments:
Post a Comment