By: Tony_Caldaro
Gap openings continued to be the theme for January with four more this week, and 15 in 20 trading days. The market started the week at SPX 2052, bounced to 2058 on Monday, declined by Thursday to 1989, bounced, and then ended the week at 1995. For the week the SPX/DOW were -2.85%, the NDX/NAZ were -2.90%, and the DJ World index was -1.65%. On the economic front reports came in even. On the uptick: consumer confidence, new home sales, the Chicago PMI, the WLEI, and weekly jobless claims improved. On the downtick: durable goods, Case-Shiller, pending home sales, consumer sentiment and the GDP declined. Next week’s economic reports will be highlighted by Payrolls, ISM and the PCE.
LONG TERM: bull market
It has been one week since the ECB announced their 1.14tn euro EQE program, and apparently the market has responded with: “buy the rumor-sell the news”. With the exception of last week, the US market has been down every week this month. Despite a four of five week decline, the market has only lost 4.5% since the last week of December.
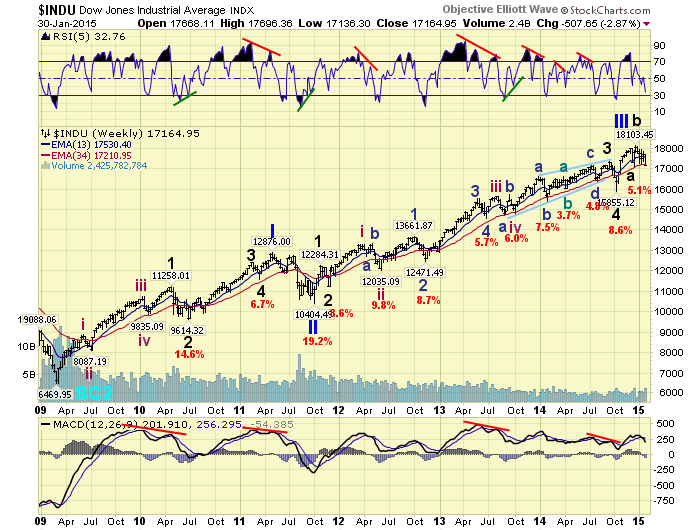
With the month of January now in the books, and no new highs, our next long term price projection remains on hold. While our long term indicators suggest we have not even reached a Primary wave III high for this market, let alone a bull market high. We think it is prudent to at least entertain the Primary III count. History has shown that no indicators are perfect, and this market has been full of surprises since it began in 2009. With this in mind we have updated the DOW charts to display a potential Primary III completed at the early December high. Then we have a Major wave a down into the mid-December low, followed by an irregular Major wave b into the late-December high, with now Major c underway. Should this count prove to be correct, which we give a 20% probability, we would expect this downtrend to take the DOW to at the least the October low at 15,855.
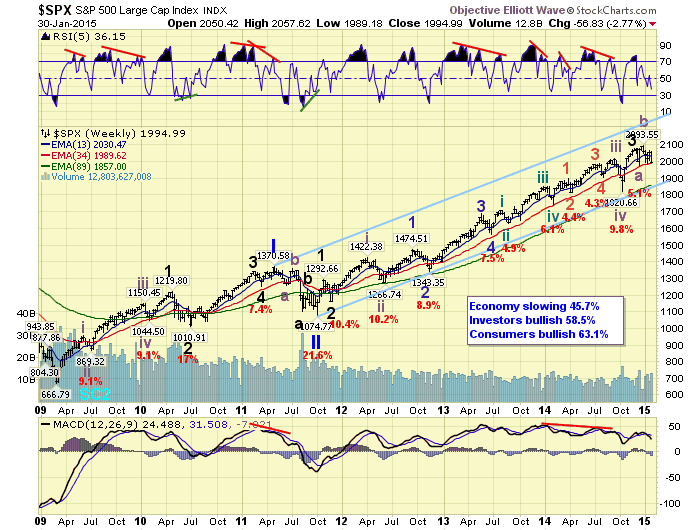
Our main count, with a 70% probability, is still carried on the SPX/NDX charts. This count suggests Primary III is still unfolding, and the market is currently downtrending in Major wave 4. When the downtrend concludes, a simple or subdividing Major wave 5 should take the market to all time new highs. Then after a Primary III high, a Primary IV correction will occur before Primary V takes the market yet again to new highs. This count also suggests this market has much further to go on the upside before the bull market concludes.
MEDIUM TERM: downtrend
For the past few weeks we waited patiently while this market decided to continue the recent uptrend, or stall and confirm a downtrend. As the market traded between SPX 1988 and 2065 during the month, we had determined 2029 would be the deciding level. Holding above it would suggest the uptrend would continue. A drop below, a downtrend has been underway. On Tuesday of this week the SPX traded down to 2020 in the first hour of trading, suggesting a downtrend has been underway. After the low the market rallied to SPX 2043, before retesting its month long support around 1988/1992 on Thursday/Friday.
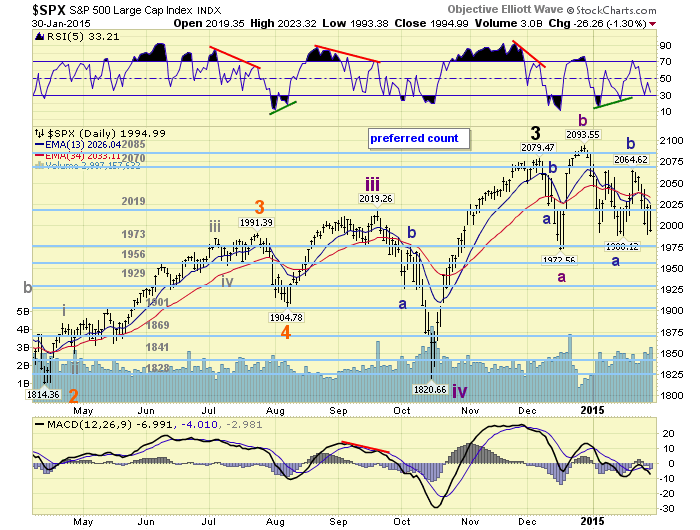
We are now counting all the activity from the early December SPX 2079 high as part of Major wave 4. With the NDX has remaining in a downtrend since that point in time, this count looks the most probable. We have been carrying this count on the SPX daily chart. This suggests the mid-December decline to SPX 1973 was Int. wave a, the rally to new highs by late-December was Int. b, and Int. wave c has been underway since then. Intermediate wave a was a simple double zigzag and it declined 106 points (2079-1973). After the Intermediate wave b uptrend, the initial decline of Intermediate wave c was also 106 points (2094-1988). We have labeled that Minor wave a, of a three Minor wave Intermediate c. The rally that followed to SPX 2065 we have labeled Minor wave b. And, the current decline from that level is an ongoing Minor wave c. When it concludes, possibly this week, Major wave 4 should end and Major wave 5 to new highs should begin. Medium term support is at the 1973 and 1956 pivots, with resistance at the 2019 and 2070 pivots.
SHORT TERM
Major wave corrections, and Intermediate waves for that matter, have declined about 10% during this bull market. A normal 10% correction would suggest a low around the OEW 1869 pivot. This is easy to spot in the weekly chart above. Since this is an irregular correction we are suggesting it may deviate from this norm, while allowing for alternation with the zigzag of Major wave 2. With Int. wave A declining 106 points, and Minor a of Int. wave C also declining 106 points we have some Fibonacci relationships worth watching.
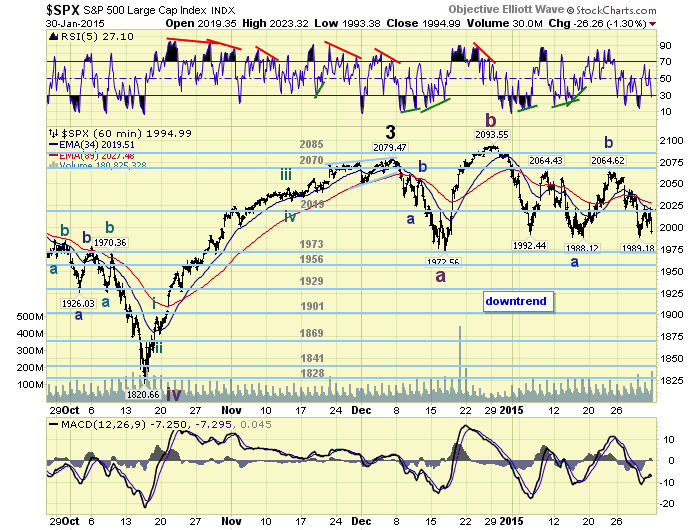
If Major 4 is forming an irregular flat it should find support around the 1973 pivot. If it is forming a more complex three wave pattern we can next look for support around the 1956 pivot, where Minor c equals Minor a. A more complex Int. wave C would suggest support around the 1929 pivot, where Int. C equals 1.618 Int. A. So we have the next three pivots: 1973, 1956 and 1929, with a worse case 1869 pivot concluding some time in February. Our initial thoughts would be for a 1973 or 1956 pivot low some time next week. Should the market reach one of those levels and is sufficiently oversold. We would then expect a five wave rally off that low to suggest a new uptrend is underway. Short term support is at SPX 1988/1993 and the 1973 pivot, with resistance at the 2019 pivot and SPX 2042/2043. Short term momentum ended the week oversold.
No comments:
Post a Comment