by Tony Caldaro
REVIEW
The market started the week at SPX 2105. After a rally to SPX 2118 on Monday the market had gap down openings three of the next four trading days. By late Friday the SPX had traded down to 2067, then ended the week at 2071. For the week the SPX/DOW were -1.55%, the NDX/NAZ were -0.80%, and the DJ World index lost 1.70%. Economic reports for the week were slightly biased to the negative again. On the uptick: personal income, the PCE, auto sales, ISM services, payrolls, plus the unemployment rate and trade deficit improved. On the downtick: personal spending, ISM manufacturing, construction spending, the ADP, factory orders, consumer credit, the WLEI, the monetary base, plus weekly jobless claims rose. Next week we get reports on Retail sales, the PPI and Consumer sentiment.
LONG TERM: bull market
We continue to count this six year Cycle wave [1] bull market unfolding in five Primary waves. Primary waves I and II occurred in 2011 and Primary wave III has been underway since then. While Primary I was a relatively simple two year advance of five Major waves, with only a subdividing Major wave 1. Primary III has already entered its fourth year, with an extensively subdivided Major wave 3 after a simple Major wave 1. Since we are expecting Primary III to continue into the year 2016, we are expecting Major wave 5 to subdivide as well.
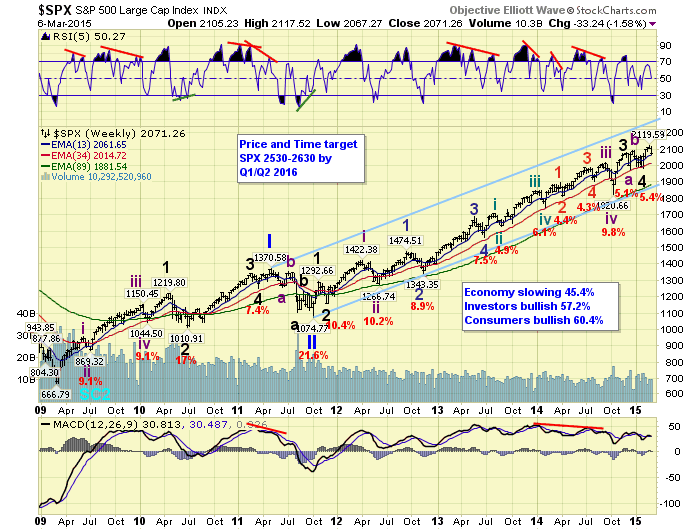
We recently posted price and time targets for Primary III: SPX 2530-2630 by Q1/Q2 2016. As you will note in the weekly chart above, Primary III has spent most of its time trading around the mid-point of the rising channel from 2011. When it tops we would expect it to hit the upper trend line. Then after a serious correction for Primary IV, we would expect Primary V to take the market to all time new highs in 2017.
MEDIUM TERM: uptrend
The uptrend that started the first day of February at SPX 1981 ran into some profit taking this week, as the market experienced its biggest decline since the uptrend began. Last weekend we had noted four potential short term counts into the SPX 2120 high. Two counts suggested the uptrend was subdividing into waves of a lesser degree. Two counts suggested a five wave advance, from SPX 1981, had completed and a pullback/correction would be next.

On Monday the market held SPX 2104 and rallied to nearly a new high at 2118. This kept all four counts alive. On Tuesday, however, the market dropped below SPX 2104 eliminating one of the subdividing counts. Then on Friday the market broke below SPX 2072 eliminating the other subdividing count. As a result we are left with a completed five wave pattern from SPX 1981 to 2120, and a pullback/correction underway. The five waves were previously noted: 2072-2042-2102-2085-2120.
With the five wave pattern we now have two possibilities. Either the SPX 2120 high completed the uptrend, or it is just Minor wave 1 of the uptrend. After reviewing the RSI on the weekly chart we arrived at the conclusion that the recent five wave advance is only Minor wave 1 of the uptrend. If it was the entire advance it would be the weakest impulsive wave, non B-wave, of the entire bull market. It looks similar to the beginning of Major 3 of Primary I, and the beginning of Minor 3 of Primary III. Both had small advances to start their uptrends, pulled back without ever reaching overbought, then resumed their uptrends. We will go with this count and discuss it in the section below. Medium term support is at the 2070 and 2019 pivots, with resistance at the 2085 and 2131 pivots.
SHORT TERM
As noted above we had a five wave advance from SPX 1981 to 2120: 2072-2042-2102-2085-2120. For now we are going to label this advance Minor wave 1, of a five Minor wave Intermediate one uptrend, with Minor 2 currently underway. Since the fifth wave of the advance was the weakest, wave structure support, for Minor 2, should arrive between SPX 2042 and 2072. Also there are three possible Fibonacci levels for the pullback: 38.2% (2067), 50% (2051) and 61.8% (2034). The SPX 2067 level is the actual low of the pullback thus far. Since the 2051 and 2067 levels fall in between the 2042-2072 range, we would expect one of these two to provide Minor 2 support.
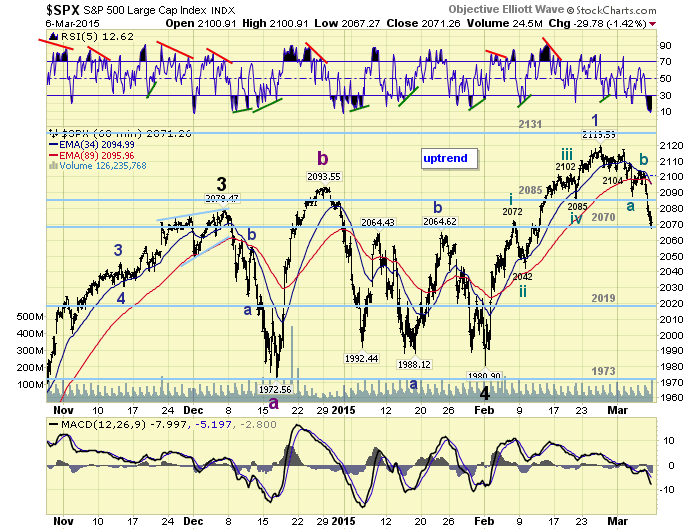
In order to consider this advance a completed uptrend, this pullback/correction will have to drop below the OEW 2019 pivot. Until that occurs we will continue to expect this uptrend to resume once this pullback ends. Short term support is at SPX 2051 and the 2070 pivot, with resistance at the 2085 pivot and SPX 2120. Short term momentum ended the week extremely oversold.
No comments:
Post a Comment