When you think about it, the imminent spike in mining related investment and its impact on Australian GDP is a pretty fair reflection of what has been going on in China for some time. Martin Wolf recently opined on the sustainability of China’s GDP growth without the government sanctioned infrastructure binge (here). It’s the Jim Chanos view of the world, ease off the building and things don’t just slow, they go into reverse pretty quickly. The following charts hint at what’s at stake:
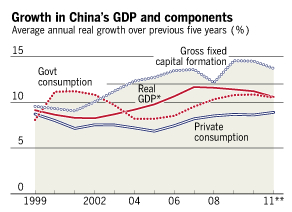
1) The importance of infrastructure investment (Gross fixed capital formation) in driving China’s GDP growth over the last decade is self-evident:
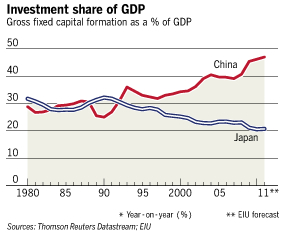
2) And even more simply stated as a proportion of GDP:
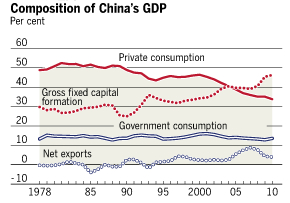
3) So it is clear just how difficult is the task is to migrate the driver of GDP growth from investment to consumption.
4) Still that is why China is forecasting GDP growth closer to 7% for the next 5 years – it’ll be weaning the economy off the debt financed infrastructure spend ever so gradually:
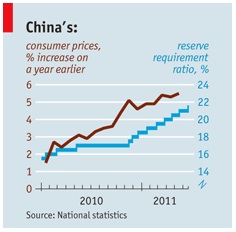
5) But the risk is that the problems have already been conceived – China’s financial system is pregnant with debt that has financed investments that will prove uneconomic if the rate of GDP growth (and the attendant asset price inflation) slows.
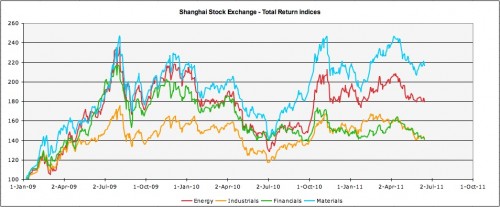
Looked at from this perspective, it has remarkable similarities to the debt overhang that persists in the developed world – and the resulting underperformance of financial equities from New York to London and beyond.
No comments:
Post a Comment