In this Weekend Report lets take an unbiased look at the HUI, gold and silver to see if there are any big changes taking place to upset the apple cart so to speak. Emotions can turn on a dime in the markets, as you are all well aware of, from bearish to bullish or the other way around in a heart beat. That’s what the markets thrive on. Being open to change and not being married to a position is critical to survival when you put your hard earned capital to work in the markets.
Lets start by looking at a daily linear chart for the HUI that shows the decline that started back in September of last year that formed the right shoulder of the massive H&S top pattern that most staunch gold bugs still can’t see. There are three chart patterns I’m going to show you that formed off the right shoulder high to the current low at 205. First I want you to look at the two blue bearish expanding falling wedges labeled #1 and #2. Those two patterns are almost exactly the same in time and height. For those that want to see what I mean just set your chart to linear scale and go back a little over a year. Draw in the top blue expanding falling wedge, as you see on the chart below, and grab your top rail and pull it on top of where the lower blue wedge is forming. Then do the same thing with the bottom rail of blue wedge #1 and take it down to bottom of blue wedge #2. I’ve added two thin black rectangles that shows your how closely they are to each other in time and height, labeled one through four. There is a lot of information on this chart so I’ll post it right here so you can see how similar these two patterns actually are. Then I will post this same chart with some more information that is relevant to our most recent low.
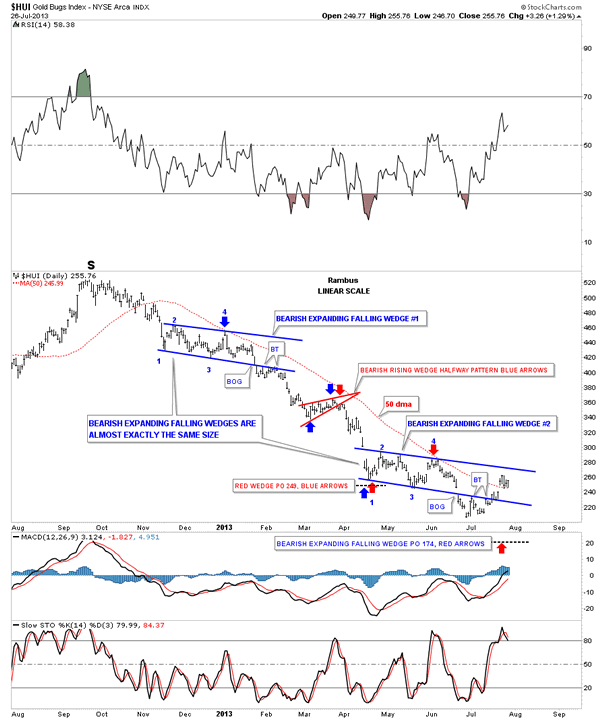
Now looking at the same exact chart I want to show you how the little red bearish rising wedge worked out as a halfway pattern to the downside as measured by the blue arrows. As you can see the price action fell just shy of hitting its price objective at 249 which is close enough in this game. One of two things could happen at that first low in the lower bearish falling wedge #2 and that is the price action could form another consolidation pattern or a reversal pattern. As the HUI was in a strong downtrend I decided to see what would take place. Over the course of the next 2 months or so the bearish expanding falling wedge formed and then had that huge breakout gap to the downside that strongly suggested the pattern was a consolidation pattern. Note how similar the backtests were to the falling wedge #1 and #2, almost identical. They both had 2 backtests to the underside of the blue falling wedges. Everything looked fine at the second backtest. Nothing broken. Just after the second backtest to the lower falling wedge is when things started to change. As you can see the price action managed to close above the bottom rail but the next couple of days showed little conviction to the upside testing the bottom blue rail from the topside. Then a week ago this last Friday the HUI closed at the high for the day, just before the breakout gap on Monday of this past week. That was a game changer as the price action gapped above the 50 dma I was using as our sell/stop. I posted then that I was selling half of my DUST position and keeping the other half as a core position. As you can see the 50 dma has been cradling the price action since the big breakout gap on Monday. What has been so frustrating is that setup, for the price objective for the lower bearish falling wedge # 2, red arrows, was down to the 175 area that would have put us into that 150 to 160 price target I’ve been expecting since early on in this major impulse leg down. A capitulation spike down to the 150 area would have been to easy as everybody and their brother, including me were looking for the same thing. With the false breakout of falling wedge #2 that makes it possible that we could see a counter trend rally now to trap all the bears that were looking for the 2008 low. An opportunity missed could very well be an opportunity gained.
Lets take another look at the 60 minute chart I posted Friday night that shows how the HUI has now been making higher highs and higher lows unlike anytime since the impulse leg down began last September. This is the first thing we have to see in order to get an uptrend. So this can’t be ignored. The double bottom trendline is now our line in the sand, above it’s positive and below it’s negative. Sir Matrix has asked me several times why do I show these indicators when I don’t speak of them much. One reason I like to watch them is for patterns that can form, such as the double bottom on the RSI at the top of the chart.
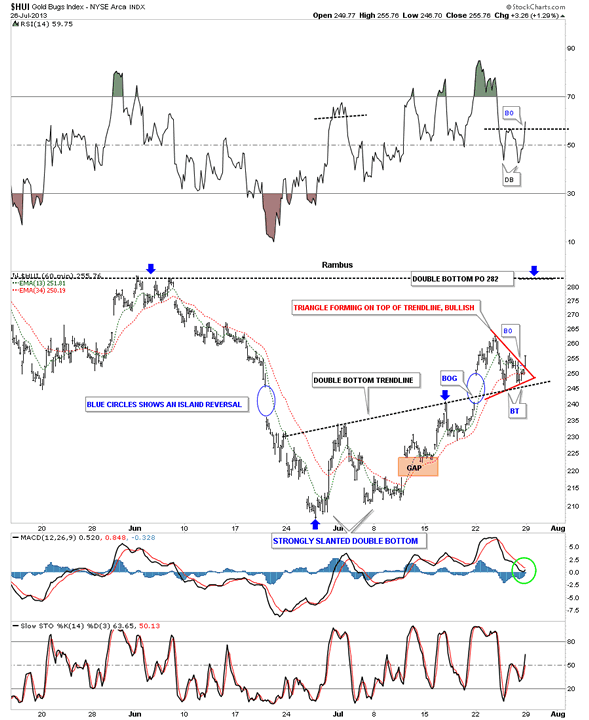
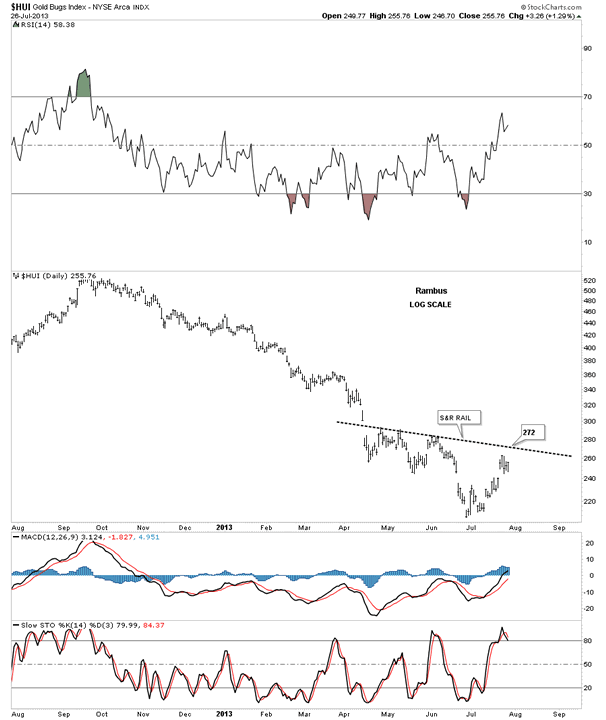
Below is just a simple bar chart with a support and resistance rail on it that shows a break above 272 would would be significant in the short term. This is also a point where an inverse H&S bottom could develop a right shoulder if the move up is going to be of an intermediate nature. This is why I call these areas inflection points as the price action could go either way yet.
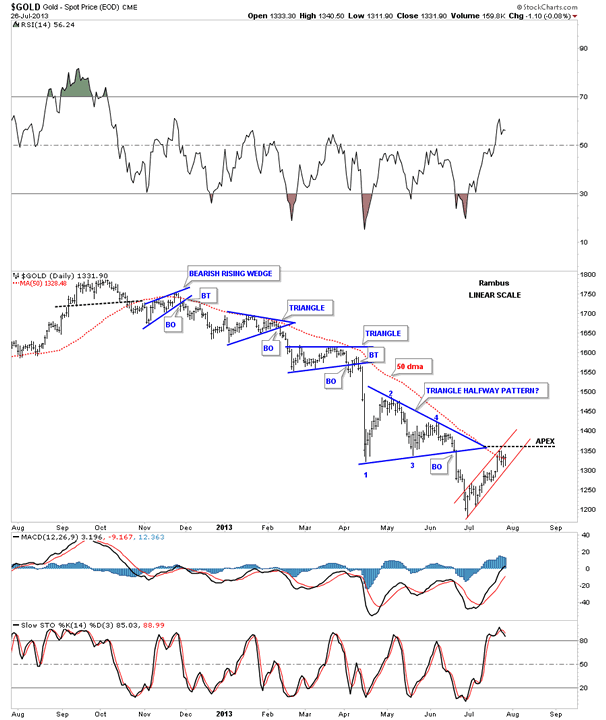
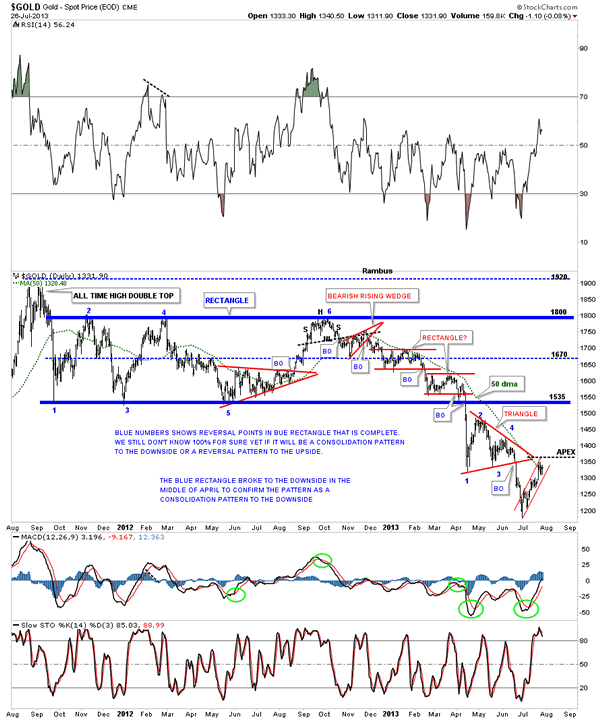
Lets turn our attention to gold that is approaching critical overhead resistance right now. The apex of that blue triangle is the key for the short term. If gold can manage to close above that apex, which comes in around the 1355 area, that would be bullish for the short term. The price action is interacting with the 50 dma in here also.
Below is a long term look at gold that shows the 20 month rectangle that broke down in April of this year. If gold can take out the apex of the red triangle then the bottom of the big blue 20 month rectangle would be a concrete ceiling. The only way a new bull market can start for gold would be for it to takeout the bottom rail of the rectangle around the 1535 area. That would be showing considerable strength. That’s a huge consolidation pattern that won’t be easily overcome.
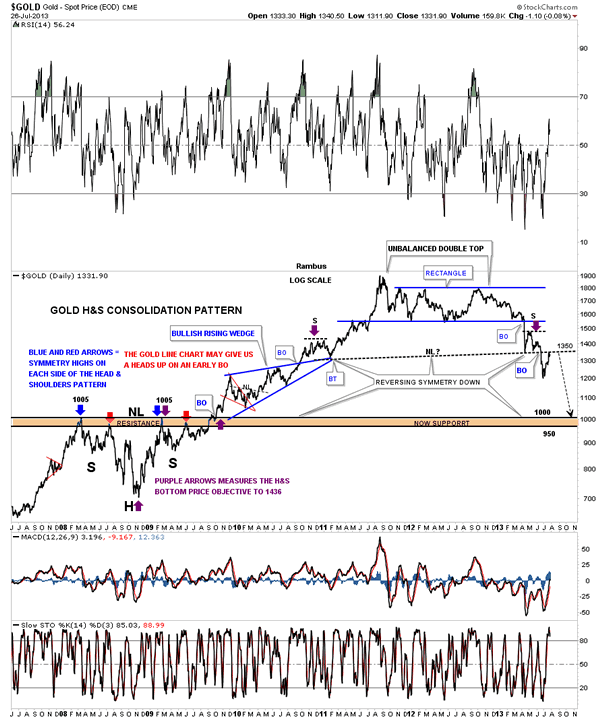
Below is the gold symmetry chart we’ve been following since I put that purple arrow on the right side of the chart. As you can see the price action hit the neckline? and bounced off telling us it’s hot. A break above that neckline that comes in above the 1350 area would be bullish for the bulls. So far nothing is broken yet on gold.
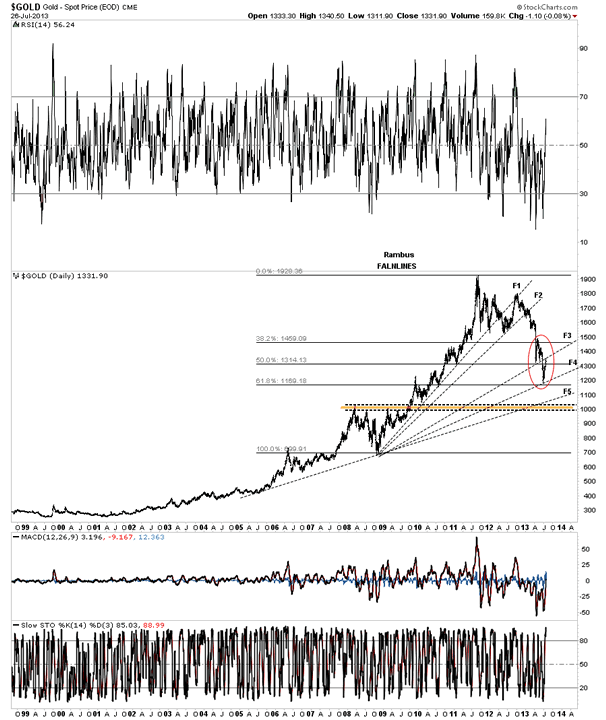
Below is a daily chart for gold that shows the fanlines made off the 2008 low. The red circle shows how gold fell to the 50% retrace and rallied backup to the underside of the 38% line. The last decline took gold almost all the way down to the 62% retrace where it is getting a bounce now to the underside of the third fanline. This chart is just one more example of why the 1350 area is so critical to hold as resistance if your short gold.
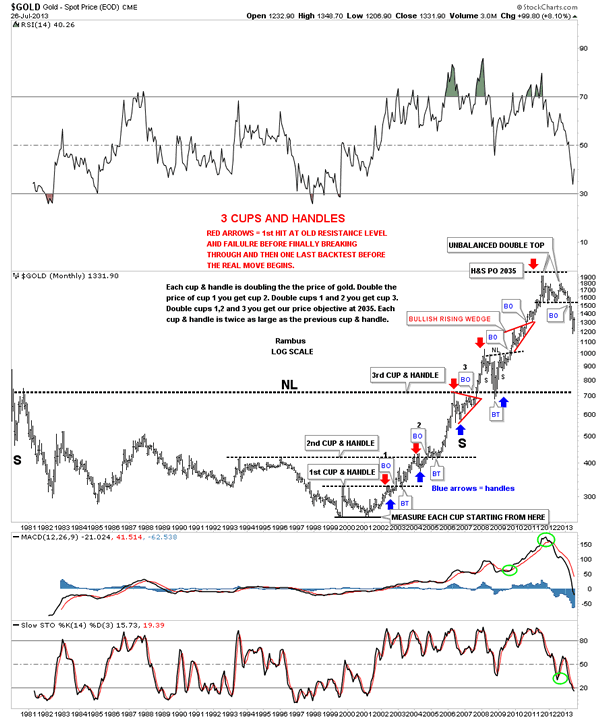
Below is the very long term chart for gold that I’ve shown you several times in the past. The only question I have is, does gold backtest the rectangle or as it shows up on this long therm monthly chart, an unbalanced double top at 1535. This chart doesn’t show a new bull market getting ready for takeoff anytime soon.
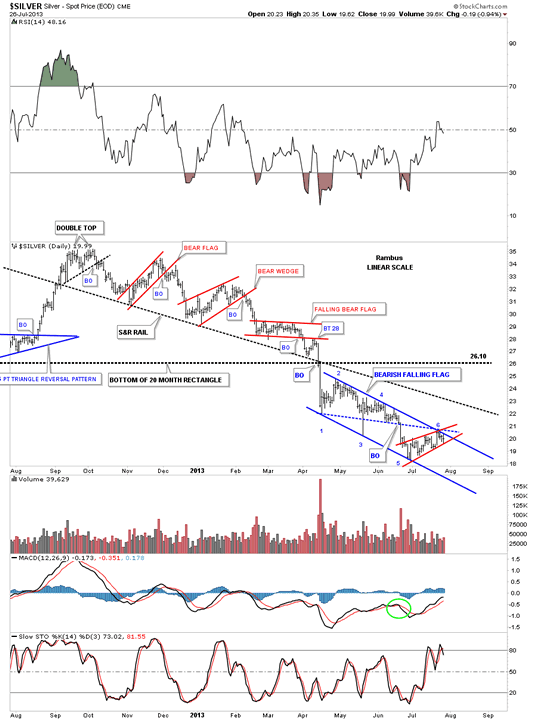
As with gold and the HUI silver is also at critical juncture right here at reversal point #6. That blue downtrend channel can be drawn two different ways. The first way is with the solid parallel trendlines that have completed 5 reversal points with the 6th one that could be the beginning of the move down toward the bottom. As it has 5 completed reversal points a breakout of above #6 would be bullish for silver as that would create a reversal pattern to the upside. Where the blue dashed trendline is positioned, takes out that Sunday night flash crash and rally back up the next day. If you takeout the flash crash you then have a bearish falling wedge. You can see the confluences at point #6 that makes that area critically important.
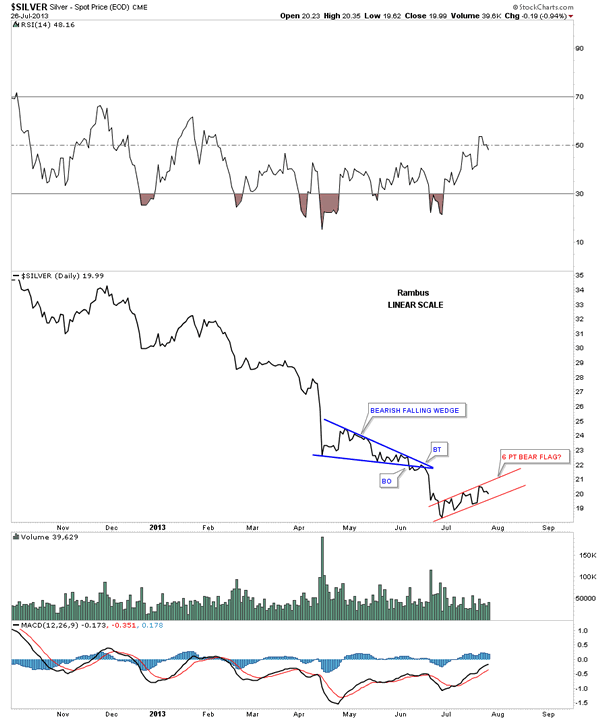
The daily look at the line chart for silver shows you a clearer picture of the blue bearish falling wedge and the potential 6 point red bear flag. So we wait for further developments.
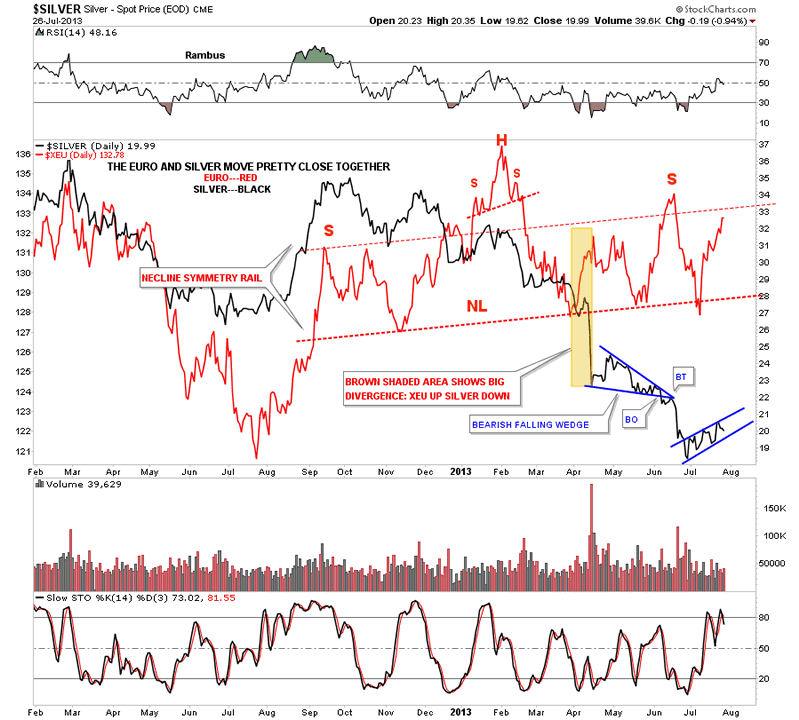
This next chart I overlaid silver over the XEU as they tend to move together. The XEU in red is coming back up to test the neckline symmetry rail again around the 33 area. The red neckline now has 4 touches that makes that rail very important if it ever gets broken to the downside. Silver has been diverging from the XEU where I put in the brown shaded area. While the XEU has been much stronger silver just consolidates and moves lower. One of the two is lying.
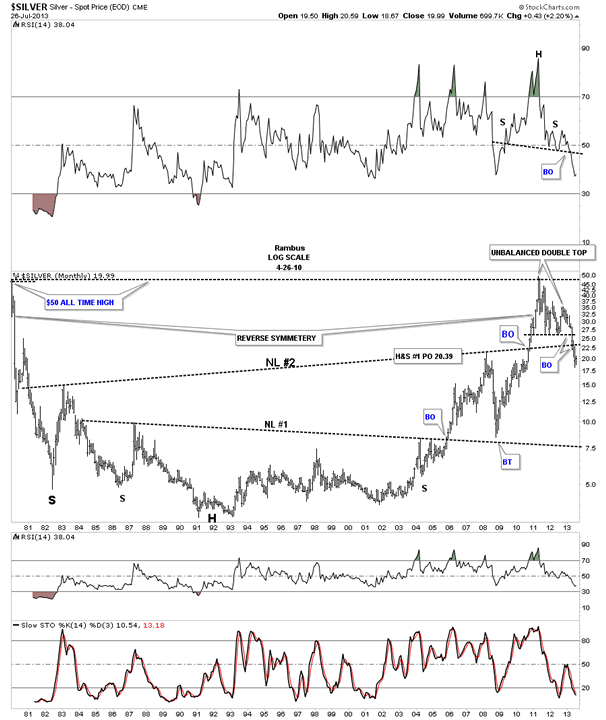
Below is a very long term look at silver that goes back to the 1980 high at 50. Like the long term gold chart above shows, silver to has a big top pattern in place. You can call it anything you like but once it broke below the black dashed horizontal rail or the bottom of its 20 month rectangle it became a top. As you can see it also has broken down below neckline #2 which if it was in a true bull market that neckline would have held support like the bottom one did.
This has been an unbiased look at the precious metal complex that shows us the long term look for this sector looks bleak for the foreseeable future. On the shorter term scale gold and silver are up against their resistance points with gold at 1350 and silver just below the 21 area. If the HUI breaks out and moves higher I think it will take gold and silver kicking and screaming higher over the short term. I have several precious metals stocks that I’ll recommend in the coming days as we see how the very short terms plays out. This is what a possible inflection point feels like. Do we move higher or do we move lower. I want to see just a little more positive price action for gold and silver before I pull the trigger. Keep in mind if the HUI does indeed breaks out to the upside this is just going to be a counter trend rally which we can choose to play or stay on the sidelines. Knowing myself I will choose to play the potential rally but that doesn’t mean everyone needs to do so. Sometimes having a cash position while waiting for the next move in the primary trend maybe the best course of action. Keep your sell/stops in place as we await for a little more confirmation of a short term trend change to the upside. It won’t take much to pull the trigger if that is to be the case. All the best…Rambus
No comments:
Post a Comment