by Dana Lyons
We have written quite a bit about the behavior in the volatility indexes of late due to their noteworthy and in some cases, peculiar, behavior. Once again, these volatility indexes, like the VIX (Volatility Index on the S&P 500), measure the market’s expectations of future volatility. One example of peculiar behavior from the VIX was the subject of our Chart Of The Day today. The VIX and the S&P 500 (SPX) typically go in opposite directions. As stocks rise, the VIX normally declines and vice versa. Therefore, it is unusual to find both the VIX and the SPX near 52-week highs.
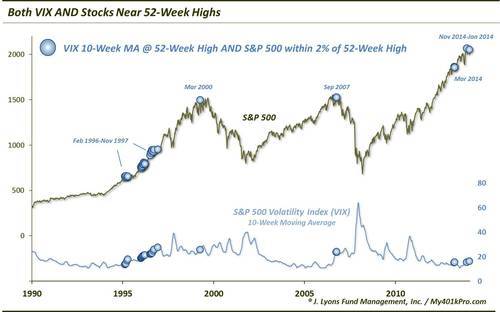
After bottoming in July, the VIX has been generally trending upward since. Smoothing out the spikes along the way by using its 10-week moving average (approximate 50-day moving average), we find the VIX trading at a 52-week high. At the same time, the S&P 500 is presently within 2% of its own 52-week high. This is an unusual circumstance that has occurred on just 4 other unique occasions since the VIX’s inception in 1986.
From early 1996 to late 1997, there were no fewer than 23 weeks that saw both the VIX 10-week moving average at a 52-week high and the SPX near its high as well. These occurrences followed one of the lowest volatility periods in the stock market’s history. Between 1993 and 1994, the S&P 500 traded within a total range of 11%. For perspective, the Flash Crash in 2010 saw the market nearly equal that range in one day. In 1995, the market broke out and trended upward in a rally so smooth, it makes 2013-2014 look like a roller coaster ride. That was the end of the historic low-volatility period, however.
Beginning in 1996, volatility began to rise. But not because of any significant market damage. Stocks continued their epic upside blowoff the rest of the decade, capping off the secular bull market. Volatility simply could not remain as low as it was in the mod-1990’s period. You could say that volatility expectations simply returned to more “normal” levels. You could also say that in the standoff between the two indexes at their highs, the VIX blinked, as the S&P 500 continued to power higher in the face of the rising VIX.
The other instances were a bit different. From 1998 to 2013, there were just 3 weeks that saw the VIX 10-day SMA at a 52-week high while stocks were also near a 52-week high. One week was in March 2000 and 2 were in September 2007. I probably don’t need to describe these two periods to observers (just peek at the chart in case you’re unsure of what I mean). Obviously the S&P 500 blinked on those two occasions as stocks immediately rolled over into cyclical bear markets. Those two instances were cases of volatility expectations rising (correctly) following 4-5 years of persistent stock market gains.
It is not our intent to “fear-monger” regarding the stock market’s prospects. Our M.O. is simply to point out what is happening and we are seeing a very similar development as in 2000 and 2007 currently. The market is almost in year 6 of a cyclical bull market and the VIX is beginning to rise, in spite of higher stock prices. 2000 and 2007 each saw the VIX bottom 8-10 months before the stock market topped. It has now been over 7 months since the July VIX low was put in. While the market does not need to follow the same pattern as the previous two tops (indeed, no 2 cycles are exactly the same), this is a characteristic that we saw at the 2000 and 2007 tops.
Perhaps the S&P 500 will roll right over this signal like it did in March of 2014. This occurrence is a bit different, however, in that the VIX is showing a much more demonstrative move higher. In our view, expectations for higher volatility ahead are clearly being demonstrated. Can the VIX and stocks co-exist at these levels for much longer? We doubt it. Odds are we’ll see one of them blink. And we would not be surprised if it is the stock market this time.
No comments:
Post a Comment