| In more typical climates you would come to believe that a decided lack of volatility in credit markets would be welcomed as an unmitigated positive. Credit is not supposed to be beset by whirlwinds from the political world, reflecting a more traditional paradigm when banks were simply custodial agents rather than proprietary hedge funds. The banking system was never supposed to (from an outside perspective) derive the vast majority of its “earned” income from trading. Yet that is exactly what has taken place most recently, and on both accounts. Bank earnings are whispered again to be less than enthralling, blamed without reservation on fixed income.
There is a little conflation of causations here, with fixed income trading having its own difficulties set apart (though related) from fixed income issuance. For the mega-banks, there are problems at both ends, particularly as mortgage markets reject Yellen’s continued “support.” But there can also be no doubt that trading is being affected by what I recently called confused stasis. Agents and prop traders derive much less profit from stable or low volatility markets.
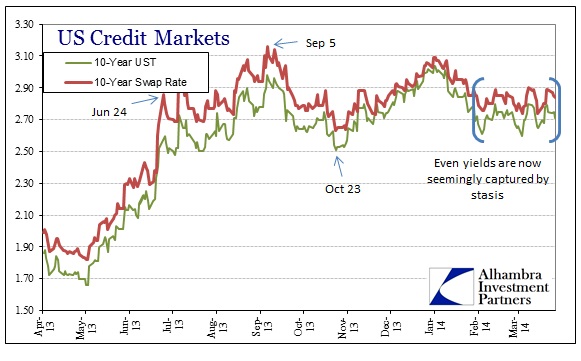
My initial reference for this condition related to credit market expectations for inflation, as inflation breakevens have exhibited a curious inability to move in one direction or the other. Instead, they hover. While the longest such period of confused stasis is attached to inflation expectations, it seems that the same kind of inability to foment momentum toward an approach or interpretation has spread to other sections of credit. In terms of swap spreads, both the 5-year and 10-year have entered this “hover”, centered right at 10 bp (the one exception being Janet Yellen’s first press conference which seems to have blown up some trades and are thus hidden and included in the generalized bank “earnings” slump due to “fixed income”).
We can also see the “hover” in treasury markets, as the benchmark 10-year treasury is strangely attracted to the 2.60%-2.80% range.
However, this stasis is not monolithic, only nearly so, as there is movement in discrete arenas.
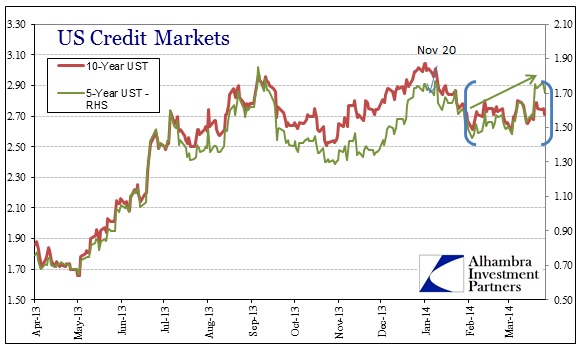
The 5-year maturity has seen a rather notable selloff, particularly very recently. The net result is a far flatter yield curve, centered within that space between the 5s and 10s.
I have referred to the Fed’s sudden interest (post November 20) in the 10-year before, so there are surely POMO artifacts to consider here. But even factoring that into any analysis, the selling in the 5-year part of the curve does not seem to denote additional tightening, particularly in dollar and funding terms.
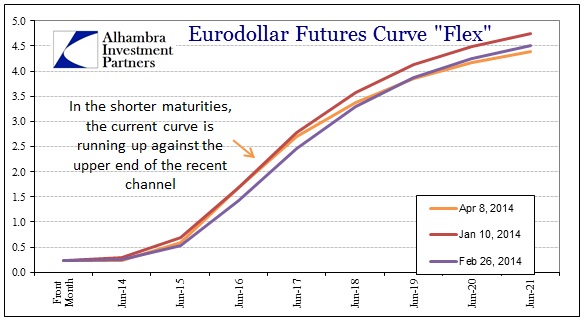
For the most part there is very little volatility in eurodollar futures, again the “hover” or stasis. What movement is contained here is a microcosm of the action in treasuries, as the curve has flattened in both.
So while the current eurodollar curve remains largely within the channel carved out post-taper, we see the very definite signs of selling short (or mid) and buying long – flattener trades. That would conform to the observations in the treasury curve, where it is not a generalized selloff (as would be the case if eurodollars were tightening) but repositioning across the middle and outer years. In the treasury case, there is definite selling around the 5’s and buying in the outer years past the 10’s, with the 10’s acting as a pivot. So what does all this mean? In broader terms, it’s not fully clear but there are some tantalizing clues. My main point originally in pointing out the “confused stasis” of inflation was that “market” participants seem very much torn between following the Fed with regard to inflation, but never fully pulling the trigger because current observations (including the obvious trajectory) are fully contradictory. I think we might extend that theory into these other credit spaces. What is curious is that these apparent tendencies toward “hover” time to the start of Janet Yellen’s tenure. Each of the bracketed stasis periods above (with the exception of inflation breakevens which began far earlier) started in the last days of January or the first days in February. Yellen was confirmed by the Senate on January 6, but took office on February 3. That is certainly not enough to form definitive conclusions about any of this, but I think it does conform to the idea that credit markets, and these places in particular, are more than a little unsure about policy direction right now. That has not stopped a repositioning (bearish, I might add) from taking place, but a larger selloff or tightening in the secondary markets has been set aside (or a loosening/buying spree, for that matter). In basic and general terms, credit wants to believe in Yellen but is not willing to back both her economic optimism and outward dovishness – this contrasts very highly with what we saw in September 2012 fully backing (negative swap spreads among other indications) Bernanke’s QE3 sellout. |
Wednesday, April 9, 2014
Fed Word Clouds At Work: Indigestion In The Belly Of The Curve


Subscribe to:
Post Comments (Atom)
No comments:
Post a Comment