by David Stockman
| The mainstream recovery narrative has an astounding “recency bias”. According to all the CNBC talking heads, the 192,000 NFP jobs gain reported on Friday constituted another “strong” report card. Well, let’s see. Approximately 75 months ago (December 2007) at the cyclical peak before the so-called Great Recession, the BLS reported 138.4 million NFP jobs. When the hosanna chorus broke into song last Friday, the reported figure was 137.9 million NFP jobs. By the lights of old-fashioned subtraction, therefore, we are still 500k jobs short—notwithstanding $3.5 trillion of money printing in the interim. The truth is, all the ballyhooed “new jobs” celebrated on bubblevision month-after-month have actually been “born again” jobs. That is, jobs which were created during the Fed’s 2002-2007 bubble inflation; lost in the aftermath of the September 2008 meltdown; and then “recovered” during the renewed bubble inflation now underway. Stated differently, back when the NFP jobs count first clocked in at 137.9 million in the fall of 2007, the talking heads assured us that we were in a permanent “goldilocks economy” thanks to the brilliant management skills of the Fed. So here we are nearly 7 years later, still a half million jobs short, and the talking heads are gumming once again about the same old illusory “goldilocks”. Who actually pays these people to bloviate! Setting aside the utterly superficial recency bias, its not hard to see the dire reality lurking in the actual trends. To be precise, 75 months into the post-2000 cycle the US economy had generated 5 million net new jobs—that is, it was way above its prior high water mark. Likewise, 75 months on from the 1990 peak, it had produced 10 million net new jobs. So the fact that we are still in negative jobs territory this far into a recovery cycle is literally off-the-historical-charts. And the fact that we are already in month 57 of this business expansion when the ten expansions since 1950 have averaged only 53 months in duration is even more telling. Notwithstanding Bernanke’s hubristic proclamation of the Great Moderation, the Fed has not abolished recessions—so this time the cyclical clock may run out long before many actual “new jobs” are created. Indeed, by any reasonable standard, an economy which has gained 10 million new working age citizens during the past 7 years, but has generated not a single net new NFP job is failing badly. The Friday report, like the dozens before it, should have been a cause for alarm, not celebration. In fact, the true story is even worse for two reasons. First, as shown below the quality-mix of even these “born again” jobs has deteriorated sharply. Secondly, the 7 million jobs that were recovered since the official recession bottom in June 2009 had virtually nothing to do with the massive money printing campaign of the Fed or, for that matter, the rest of the Washington stimulus spree of bailouts and boondoggles. Consider first the quality deterioration, and the fact that when it comes to economics the proper metric is surely not one-job-one-vote. About half of the jobs in the NFP consist of “breadwinner” jobs in the core sectors—–manufacturing, construction, the white collar professions, FIRE, transportation and trade, information services and media and business management and support services. According to the BLS establishment survey data, these positions generate an annualized pay rate of about $45k—-marginally enough to support a family in many areas of the country. As shown below, the Breadwinner Economy has been trending south for this entire century! There were 72-73 million of these jobs in 2000; no growth happened during the entire Greenspan Bubble; a thundering collapse occurred during the Great Recession; and there has been only a tepid, fractional recovery since. In fact, among the 5.7 million Breadwinner Economy jobs lost by the time the recession officially ended in June 2009—- only 37 percent have been recovered during the nearly five years since then. And that’s notwithstanding the ritual proclamations about “progress” on each and every “Jobs Friday”.
Breadwinner Economy – Click to enlarge As shown below, jobs in the Breadwinner Economy pay 2.5X those in the Part Time Economy and 30% more than the HES Complex. So the implications for economic growth and living standards are self-evident. The Breadwinner Economy with half the NFP jobs accounts for more than two-thirds of aggregate wage and salary income. Accordingly, it is not surprising that the real median household income has fallen 7% since 2000. The breadwinner jobs which support it have trended sharply downward and today clock in at only 68.3 million—a level that was first reached during Bill Clinton’s second term. Yes, there has been some recovery since the recession bottom, but the rate of gain has been tepid and underscores the borrowed time point. At the rate of recovery since June 2009—-about 37,000 per month—it would take until 2024 to get back to the 73 million Breadwinner Economy jobs posted at the time that Florida’s hanging chads were being recounted after the 2000 election. Digging deeper into the Breadwinner Economy only darkens the picture. The very highest paying jobs in this broad category are in the “goods-producing” sector— construction, mining/energy and manufacturing. The NFP count for goods-producing industries in 2000 was 24.6 million. By contrast, the number reported last Friday was 18.9 million—-23% below its level 14 years ago. And don’t look for the gap to be filled any time soon. Only 9,000 jobs per month have been created in good-producing since June 2009. So by the lights of pure arithmetic, it would take until the year 2067 to regain the January 2000 high water mark! Another big chunk of the Breadwinner Economy jobs is accounted for by what we have termed “Core Government” jobs, and it includes employment at all levels of government excluding the Post Office and Education. There were 11 million of these jobs–paying upwards of $60,000 on average— in Friday’s report and that is virtually the same figure reported for December 2007. So we are at “peak jobs” in the Core Government sector, and if anything the number of these high paying jobs will also shrink during the years ahead. That prospect is owing to the inexorably tightening fiscal vice in which the public sector is now impaled. To wit, the massive growth of transfer payments due to baby boom retirements and the failed economy’s pressure on the safety net is squeezing out all other government spending—-and most especially jobs-intensive public sector service delivery. On the other side of the ledger, publicly-held debt of government at all levels is nearly $16 trillion or 95% of GDP and rising rapidly. This means that spending growth to hire more bureaucrats will be virtually impossible—-even with borrowed money. That leaves about 38 million jobs in all the other Breadwinner Economy industries mentioned above such as FIRE, trade and transportation, business services etc.—a category we have termed “core private business services”. Even here, the March print was still 425,000 below the December 2007 peak, and, more importantly, still less than 4% above its turn of the century level of 37 million jobs. Stated differently, this category is the only part of the Breadwinner Economy which has been growing, but the rate of job creation over the last 14 years has been just 8K per month. And this points to the real scam embedded in the “Jobs Friday” celebrations. Overwhelmingly, the job count gains being reported are in the Part Time Economy. This category encompasses about 38 million NFP jobs, and consist of bell-hops, bartenders, waiters, maids, nail salons, shoe repair, street vendors, retail clerks, temp jobs and the like. According to the BLS data, these categories generate an annual full-time pay equivalent of just $20,000. These are ”survival” jobs at best, yet they account for fully one-half of all the born again jobs reported since June 2009 (3.4 million out of 7 million).
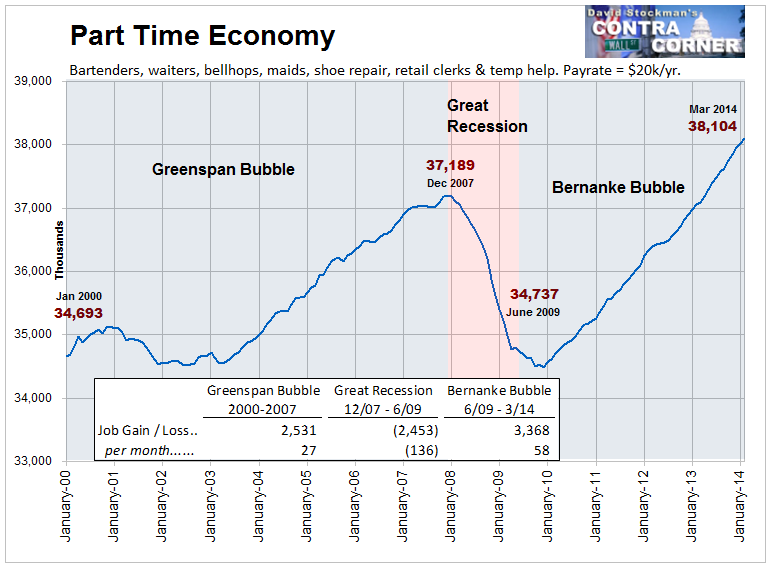
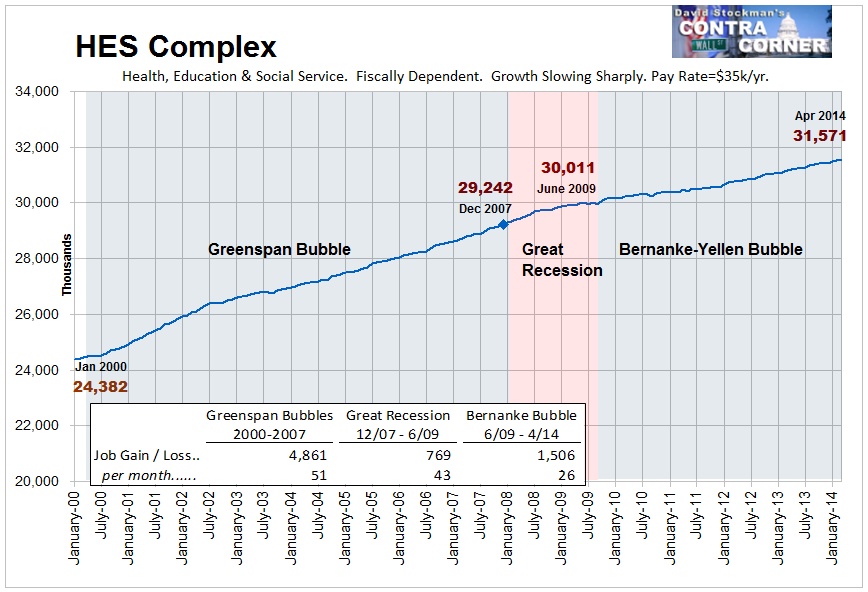
Part Time Economy – Click to enlarge Unlike the Breadwinner Economy, this sector has recovered its December 2007 high water mark of 37.2 million jobs and then some. Last Friday’s report showed 38.1 million jobs in the Part Time economy for a net gain of about 3% over the past seven years. Yet even here the story is hardly reassuring. To be precise, the Part Time Economy has gained 915,000 jobs since December 2007 and 968,000 of them—more than 100%– have been in bars, restaurants, resorts, race tracks, theme parks and other places of amusement. In short, what has materialized is a Bread & Circuses economy. The BLS category containing the above industries, called “leisure and hospitality”, posted 11.7 million jobs in January 2000. The figure for March 2014 was 14.5 million. Thus, Bread & Circuses accounted for fully 40% of the entire total of 6.9 million NFP jobs created in the American economy during the 21st century. The balance and then some is attributable to the final broad NFP category we have labeled the HES Complex, which consists of health services, education in both private and public sector and social services including day care. As shown below, this has been the growth engine of the NFP. The 31.5 million jobs in the HES Complex reported for March 2014 represented a 2.3 million gain from the December 2007 peak, and a gain of 6.8 million jobs or nearly 30% from January 2000. Yet there are more than a few skunks in this woodpile, as well. Nearly 75% of the gain in HES Complex jobs this century occurred before December 2007. That robust gain of 4.9 million jobs, however was heavily concentrated in education, nursing homes, hospitals, home health care and social assistance—which accounted for 80% of the pick-up. The common characteristic of these categories is obviously that they are heavily fiscally dependent. With the exception of hospitals, all of these categories derive 75% or more of their revenues from local, state and Federal coffers, and even in the case of hospitals, Medicare, Medicaid and other public programs account for upwards of one-half of receipts. Needless to say, the fiscal vice has been tightening steadily ever since the financial crisis. Accordingly, education jobs have been flat since December 2007 and hospital and nursing homes employment has risen at only a 1% annual rate. Overall, the rate of HES Complex job growth has thus slowed sharply—-from 51K jobs per month during the Greenspan Bubble to 43K per month during the Great Recession to just 26K since June 2009.
Health, Education, and Social Service Complex Jobs – Click to enlarge Not only has the rate of HES job growth slowed markedly in the face of peak fiscal debt, but even the job growth that has occurred has been in the lowest paying parts of the sector. That is, the gains have not been among doctors, skilled nurses or medical technicians. In fact, about 1.2 million or 80% of the HES Complex job gains since June 2009 have been among home health aids, day care workers and nursing home staff. Increasingly, what is left of the HES Complex growth machines amounts to a Bed Pan, Home Companion and Baby Sitters Brigade. Indeed, annual pay rates for the entire HES Complex average just $35,000 according to the BLS data. Obviously, the growth in recent years has been among categories where compensation is substantially lower. So this is what the Hosanna Chorus is celebrating—-a job machine that is broken and generating part-time and low-end positions that still do not add up to the 2007 high water mark. Moreover, as will be shown in the next installment, the Fed’s furious money printing has had virtually no role in generating even the “born again” jobs which have been so joyously welcomed on Jobs Friday. |

No comments:
Post a Comment