by Greg Harmon
Last week’s review of the macro market indicators suggested, heading into the Holiday shortened week that the Equity markets looked tired in their bounce. We Looked for Gold ($GLD) to consolidate or bounce in its downtrend while Crude Oil ($USO) was biased higher in the consolidation. The US Dollar Index ($UUP) looked strong and ready to continue higher while US Treasuries ($TLT) might continue their bounce in the downtrend. The Shanghai Composite ($SSEC) and Emerging Markets ($EEM) both looked to bounce in their downtrends. Volatility ($VIX) looked to remain subdued but drifting higher keeping the bias lower for the equity index ETF’s $SPY, $IWM and $QQQ. Their charts all looked to be tired in the upward move within their intermediate downtrends in the long term uptrend.
There were plenty of fireworks outside and in the market. Gold played out a dead cat bounce while Crude Oil broke out to the upside. The US Dollar continued higher while Treasuries bounced before plummeting Friday. The Shanghai Composite continued to consolidate in a tight range at the recent lows while Emerging Markets met resistance and moved back lower. Volatility drifted sideways before a selloff Friday. The Equity Index ETF’s, SPY and IWM tested the recent highs in the range with the QQQ moving higher. What does this mean for the coming week? Lets look at some charts.
As always you can see details of individual charts and more on my StockTwits feed and on chartly.)
SPY Daily, $SPY 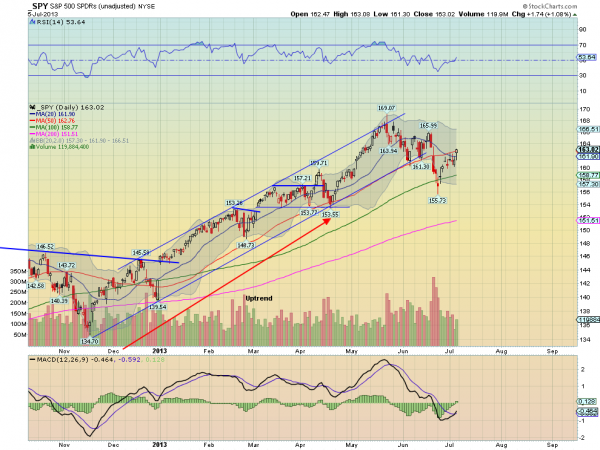
SPY Weekly, $SPY 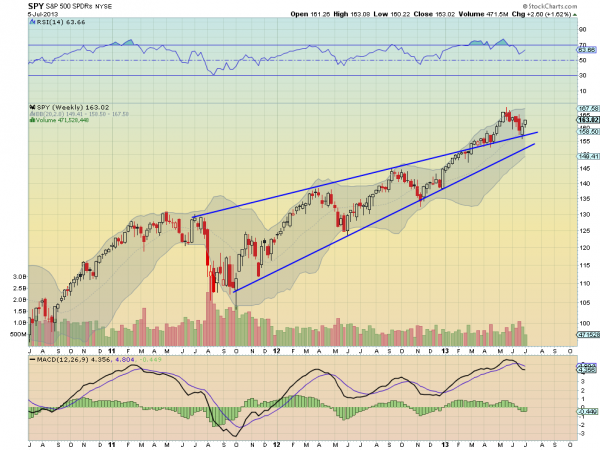
The SPY printed a series of rising small body and doji candles under the 20 and 50 day Simple Moving Averages (SMA) before surging higher to close above both on Friday. The Hanging Man candle still raises caution as it can be a reversal candle if confirmed lower on Monday. The Relative Strength Index (RSI) on the daily chart is rising back through the mid line, and never touched in bearish territory with a Moving Average Convergence Divergence indicator (MACD) that is turning higher and crossed up. These support more upward price action. The weekly picture is also leaning to the upside. The continued rise off of the retest of the wedge breakout comes with a RSI that is moving back higher and in bullish territory and a MACD that is leveling after a small pullback. There is resistance higher at 166 and 168 before 169.07, the all-time high. Support lower comes at 161.60 and 159.70 before 157.10. A move under 157.10 looks very bearish and a failure to move over 166 is bearish as well. Upward Price Action in the Intermediate Downtrend in the Long Term Uptrend.
Heading into the first full week of July sees the markets improving and possibly ready to move higher again. Look for Gold to continue its downward move or consolidate in a broad range while Crude Oil continues higher. The US Dollar Index also looks to continue to the upside while US Treasuries resume their move lower. The Shanghai Composite may continue its bounce in its downtrend, but the Emerging Markets are biased to the downside. Volatility looks to remain low and drifting lower keeping the bias higher for the equity index ETF’s SPY, IWM and QQQ. Their charts show that the IWM is the strongest and ready to continue higher while the SPY and QQQ still have some resistance to work through in their short term moves higher before they are in the clear to move higher. Use this information as you prepare for the coming week and trad’em well.
No comments:
Post a Comment