by Greg Harmon
Coffee ($KC_F, $JO) has had a hard life the last 2 years. Falling from a high over 3.08 to the current level at 1.26. There have been points along the way where it could have reversed higher, and some that have caught myself and other wrongfooted. Yet it continues lower. The monthly chart below shows that is at another of those inflection points right now. The straight line trend lower is, if only for the moment, finding support at the 200 week Simple Moving Average (SMA). As it rests there it has a Relative Strength Index (RSI) that is starting to turn higher as it is very close to the technically oversold line, and a Moving Average Convergence Divergence indicator (MACD) that has been improving on the histogram for over
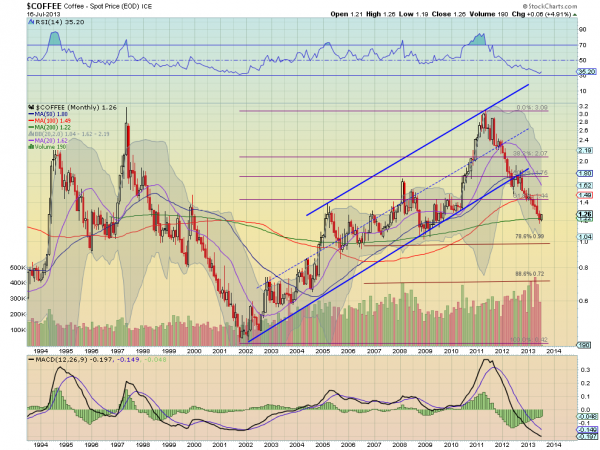
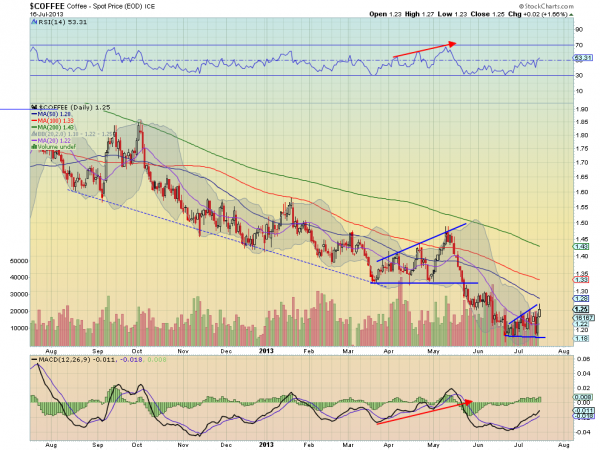
a year. That is no guarantee for a turn but does give a reference to trade against. In fact the Measured Move lower would take it to 28 cents, and the next Fibonacci level lower is at 99 cents, down another 25% from here. But the daily chart corroborates the case for a bounce. Price has been moving higher since mid June in an expanding wedge, a classic reversal pattern. The RSI is also making a 2 month high and crossing the mid line. Finally the MACD is moving higher on both the signal line and the histogram. If it wants to bounce it has the technicals aligned for it. Of course the daily chart also looked like this in April, and it did rise then, before falling over 20%. Use a stop if you trade it and that 200 month SMA seems like a good one.
No comments:
Post a Comment