by
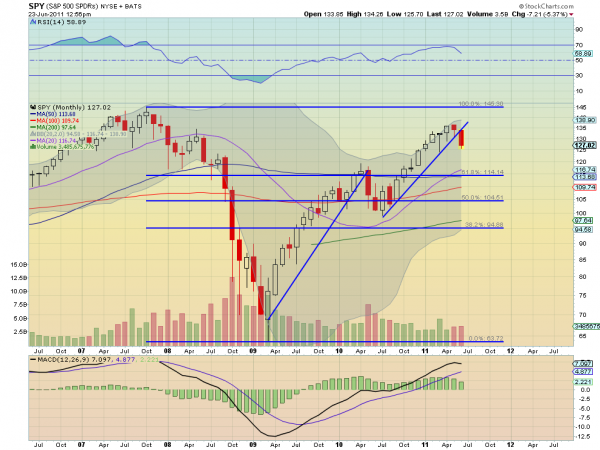
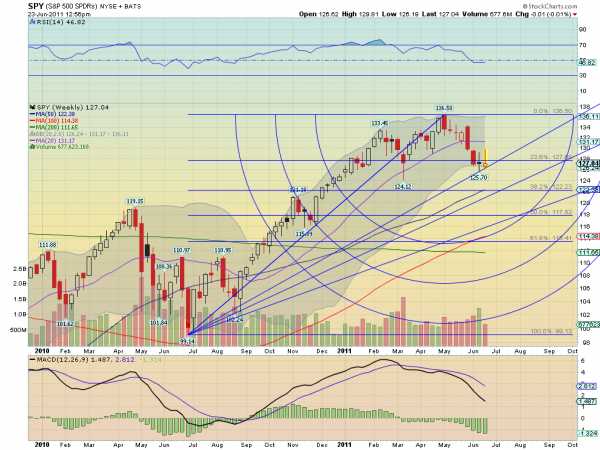
I have been calling for further downside in the weekly macro reviews the last few weeks, but have not given up that the market is still in a pullback within a bull market push higher. But the weekly chart of the S&P 500 SPDR, $SPY, with a series of Fibonacci measures on it is giving more reason to growl, when combined with the Monthly view. First the monthly chart, which shows a clear down

move with a strong long red candle through the rising trend line with only 5 and a half trading days left. Notice the Relative Strength Index (RSI) and the shorter Simple Moving Average (SMA) are both rolling lower with the Moving Average Convergence Divergence (MACD) indicator waning and volume picking up. Nothing positive here.

The weekly chart gives some indications for where next week may head. Currently the weekly candles are getting squeezed between the 23.6% Fibonacci level and the Fibonacci Fan line. The Bollinger bands are starting to expand as it rests on the Fan line. If it breaks that Fan line then a move to the cross of the lower Fan line and the 38.2% Fibonacci level at 122.23 by next week is not out of the question. Especially with the MACD growing rapidly negative. The RSI holding under the mid line will likely head toward 30 if SPY breaks that Fan line.
No comments:
Post a Comment