The collapse of the US housing market bubble gave birth to another bubble in the commodity markets. As with any other bubble, this commodity bubble has some form of a logical fundamental arguments attached to it. A key argument to support the commodity bubble is growing demand coming from the emerging Asian market. In my view, the massive money supply that is being created by the developed world central banks has now fueled this bubble further.
Beware of the supply side developments
If you speak to most of the brokers these days they will provide you with pages and pages of research highlighting the growing demand created by the emerging world. But only few bother to study the developments in the supply side of the industry. In this article I attempt to look at the demand and supply side dynamics for commodities (specifically for Iron Ore) and highlight some of the inherent risks in the commodity market.
Downside risks to demand assumptions
1. Rising inflation will force China to slow down
True, there is a vast amount of people who live in poverty in developing countries and there is massive demand to build infrastructure to support them. But at the same time, with the current high inflation levels in the emerging economies, the developing world central banks are trying to slow down the growth rate in these economies. With these actions, there is a high possibility that some of the growth assumptions turn out to be too optimistic.
2. Unlike energy, commodity demand is a one off thing
Energy demand is an accumulating thing
The beauty of the energy industry is that, the consumer continuously uses the energy. (They may change the source of energy from oil to renewable energy, but still will consume energy) The demand may fluctuate depending on the economic cycle, but once you use energy you need energy again on the next day. Just because you pump petrol into your car today doesn’t mean you will stop buying petrol. You will need petrol next week / month. And with more people joining the middle class there is going to be continued demand for energy. Just because more people in China need fuel for their cars doesn’t mean the developed world consumers stop buying fuel. So the demand for energy is an accumulating thing. More energy efficient processes will reduce the per capita consumption, but the total demand for energy should continue to grow.
Commodity demand is a one off thing
Unlike energy, when you buy iron ore (steel) to build a road / bridge, it is a one off thing. Once you build, you will not go to the market to buy iron / steel again for years.
Hence, though, it is true that China and other developing world countries need a lot of iron ore for their construction projects. Once they finish their projects, the demand will come down steadily.
3. Developed world Money Supply will slow down after June 2011
It seems the US economy has finally started to stabilize. If this trend continues, there is a good chance that Fed will not extend its QE2 program after June 2011. In my view, the massive money supply that is being created by QE1 and QE2 is partly to blame for the commodity bubble. So I believe, with QE2 coming to an end, this aspect of the bubble will end after June 2011.
Increasing supply of commodities creates an over supply scenario
1. Increasing Capex volumes
The chart below highlights the total capex expenditure by the 10 largest global Iron Ore and Diversified miners.
Chart 1: Rapid growth in capex by top 10 companies
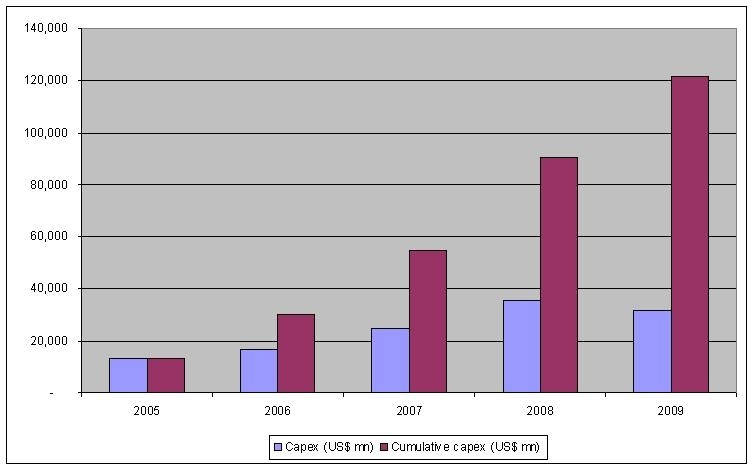
It is important to note that these are only the top 10 listed companies. There are a large number of companies based in China whose data is not publicly available.
In the table below I have summarized the total capex expenditure by the top 50 listed companies since 2005. The top 50 listed companies have increased their cumulative capex levels at a compounded growth rate of 74% over the last 4 years by the end of the 2009 financial year.
Table -1: Growing capex levels
Cum. capex (US$ Mn) | 2005 | 2006 | 2007 | 2008 | 2009 | 4 yr CAGR |
Top 10 | 13,399 | 30,283 | 54,815 | 90,126 | 121,568 | 74% |
Top 50 | 1,414 | 3,248 | 6,647 | 11,702 | 15,135 | 81% |
Total | 14,813 | 33,531 | 61,462 | 101,828 | 136,703 | 74% |
To get a feel for how big these capex projects are; I have compared the cumulative capex expenditure with the Apollo program and the Iraq war.
- The Apollo program cost US$ 24bn over almost 8 years and these top 50 listed companies has spent more than 5 times that in just over 4 years.
- According to the Congressional Research Service, it is estimated that the Iraq war cost US$2bn a week. These capex projects could have run the Iraq war for over 15 months.
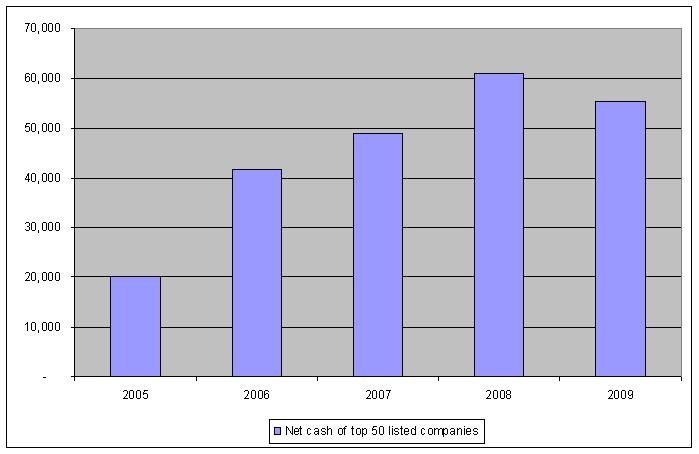
2. Increasing Net Cash positions will fund more future capex projects
The Chart below highlights the growth in the net cash position of these top 50 listed Iron Ore and diversified mining companies. By the end of the financial year 2009 they had enough cash to fund 2 Apollo projects and occupy Iraq for over 3 months.
This is only the net cash level. Given how willing the capital markets are to fund current commodity projects at the moment, there is a lot more potential for these companies to expand their capacities significantly.
Chart 2: Increasing net cash positions
3. Companies are moving into short term contracts, this can lead to an increasing volatility in earnings
To benefit from the short term price rises, mining companies are moving into a more short term pricing mechanism for commodity contracts. This will make their earnings highly correlated to the commodity prices. (Currently most of the contracts are long term and hence earnings tend to be less volatile than the commodity prices). At the moment this move is working in favor for the miners, as we are in a price rising environment. However, the moment the commodity bubble crashes the earnings are going to come down sharply. This increasing volatility in earning is not an ideal scenario for an equity investor. As the volatility of earnings increases, the risk of the investment increases and the market will pay these companies lower PE multiples.
4. Most of the iron ore Reserves are sourced from the developing world
The table given below highlights the top 10 iron ore reserves by the country. Of this list, only three countries are among the developed world and they account for only 20% of the global reserves.
If there is a scenario of oversupply of iron ore in the global markets and if prices come down drastically, the developing world countries will be willing to sell their iron ore at even lower prices to support their local economy. This will support a prolonged period of lower iron ore prices in the market with mining companies trying to cover their marginal cost.
Table -1: Global IronOre reserve levels
Rank | Reserves (Mt) | as a % of total reserves | |
1 | Russia | 34,728 | 26% |
2 | Brazil | 28,679 | 22% |
3 | Australia | 17,252 | 13% |
4 | India | 5,426 | 4% |
5 | Canada | 4,151 | 3% |
6 | China | 3,464 | 3% |
7 | South Africa | 2,123 | 2% |
8 | US | 1,834 | 1% |
9 | Sweden | 1,592 | 1% |
10 | Argentina | 402 | 0% |
Total World | 133,338 |
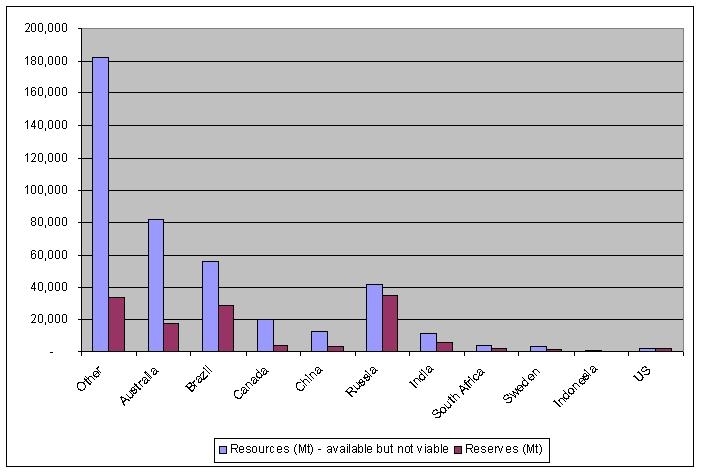
5. Increasing iron ore prices makes more projects viable
Based on a simple data search, currently there are 418,276Mt of iron ore resources in the world, but only 133,338Mt reserves are available. (i.e. There are almost 3 times more iron ore available but not economically viable to extract). These numbers don’t even include the resources available from Africa. With increasing iron ore prices, more unprofitable projects become profitable and more players will enter the market. This is another aspect of the over capacity problem I discussed earlier .Chart 3: global iron ore resources and reserves levels
Conclusion: Don’t bet your retirement money on the commodity (Iron ore) market
I believe there is an increasing risk of commodity bubble crashing in the next few years, as a result of investors realizing how optimistic the demand assumptions are, developed world QE programs coming to an end, and over capacity that is being built on by the mining companies.
Disclosure: I have no positions in any stocks mentioned, and no plans to initiate any positions within the next 72 hours.
No comments:
Post a Comment