by Greg Harmon
Small cap stocks are often looked to for leadership in the stock market. This is because on average over time they produce better returns than large cap stocks. This makes sense as a small company has one more worry that a big company does not have: survival. They are riskier companies and therefore should create higher returns. With greater sensitivity it is often possible to see trends that are beginning sooner. This is good in practicality for a long term investor and in theory for a trader. But as an observer of price action one thing I notice is that small caps are not always able to push the large caps around. It is better to study small caps on their own.
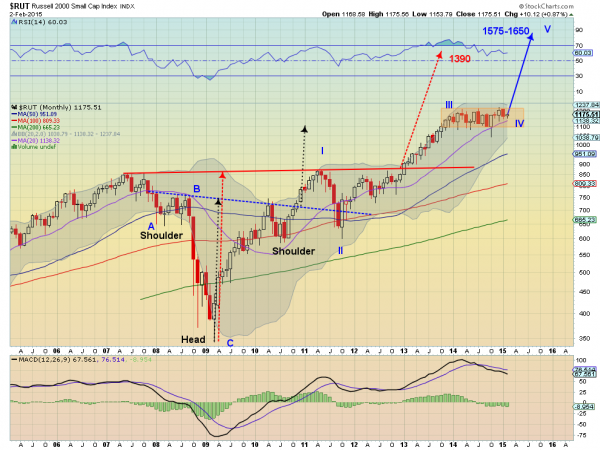
The chart above of the monthly price action in the Russell 2000, the small cap index, offers some interesting information. First notice the original ‘V’ bottom that was created with the financial crisis. The Russell was quick to move back to pre-crisis levels, faster than the S&P 500, but actually the Nasdaq 100 moved quicker.
The hiccup in May 2010 created an Inverse Head and Shoulders pattern that upon breaking the dotted neckline set a price objective of 1115. It reached that milestone in October 2013. And since then it has done nothing. Certainly no leadership for over 15 months. But is that a concern? Maybe not.
There is a second Inverse Head and Shoulders as well. This one uses the red neckline and has a much smaller left shoulder than right shoulder. It was triggered on a break of the neckline in December 2012 and carries a price objective to 1390. The 15 month consolidation comes right in the middle of the move to the price objective. Almost like a bull flag, waiting to gather strength for a move higher.
If you look at the price series from an Elliott Wave perspective, it could have a lot higher to move still. Looking at the move lower in the financial crisis as an A-B-C corrective wave, then the move from the 2009 low may just be in Wave IV of the V Wave Impulse higher. These Impulse Waves alternate between trending and corrective, with the two corrective waves having different character. That is to say that if one pulls back then the other is generally flat, like Waves II and IV. The current consolidation would make sense then. Using a little math then and assuming that Wave V extends as long as Wave I but not longer than Wave III gives a range of 1575 to 1650.
The momentum indicators are not quite as bullish though. With the RSI drifting lower there is some small weakness. But it looks like the bleed off in momentum is acting out in a sideways consolidation, not a pullback, and that RSI has now worked off the overbought condition but held very strong. The MACD is a similar story. Pulling back and crossed down, gives cause for a pullback. But the trajectory has been quite shallow thus far.
So it looks like the long train ride higher has yielded to a pause, not a correction. That is strength. If the Russell were to close materially below 1100 on a monthly basis, then you can start to look for more downside and maybe a test of the 50 month SMA at 950 or even the neckline at 900. But until the intermediate bias is sideways within the long term uptrend.
No comments:
Post a Comment