Last week’s review of the macro market indicators suggested, as the kids were back to school and the adults filed back into work from vacations that the equity markets were looking strong but with short term consolidation likely. Elsewhere looked for Gold ($GLD) to continue lower but not stray much from 1300 while Crude Oil ($USO) consolidated in its downtrend. The US Dollar Index ($UUP) looked strong and higher while US Treasuries ($TLT) were biased lower in the uptrend. The Shanghai Composite ($SSEC) was also strong and biased higher along with Emerging Markets ($EEM). Volatility ($VIX) looked to remain subdued keeping the bias higher for the equity index ETF’s $SPY, $IWM and $QQQ. Their charts showed signs of consolidation in the short run with the SPY and QQQ a bit strong on the longer timescale.
The week played out with Gold running lower while Crude Oil tested support lower. The US Dollar consolidated its move higher while Treasuries made new 1 month lows. The Shanghai Composite consolidated its move before probing higher while Emerging Markets moved lower. Volatility ticked up but remained under control. The Equity Index ETF’s basically moved sideways all week, with the SPY pulling back Monday first, and the IWM and QQQ barely changed. What does this mean for the coming week? Lets look at some charts.
As always you can see details of individual charts and more on my StockTwits feed and on chartly.)
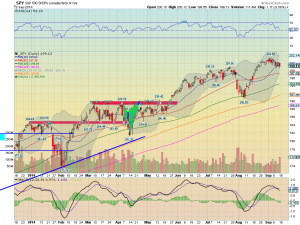
SPY Daily, $SPY
SPY Weekly, $SPY
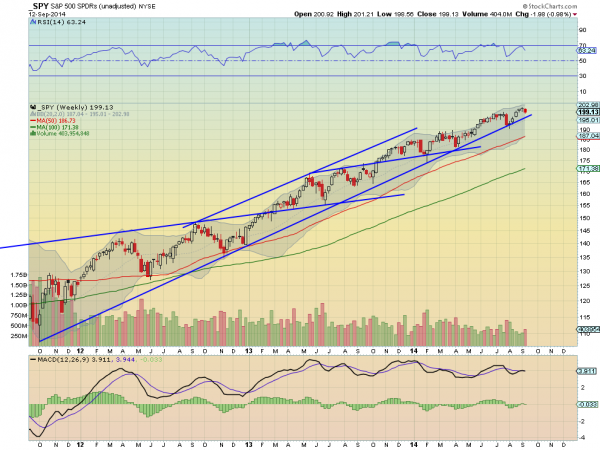
The SPY moved lower Tuesday and then consolidated in a tight range for the rest of the week around the 20 day SMA. There are indications on the daily chart that the move down may continue. The RSI is making a lower low as it heads down and the MACD is crossed down and falling, both supporting more downside. The Bollinger bands are starting to tighten and that bodes for a move soon. The weekly chart shows a strong trend higher interrupted by a small down week. It is near the rising trend support and has a RSI rolling lower with a MACD joining it, so a touch at that support may come soon. There is support lower at 199 and 198.30 followed by 196.50 and 195. Resistance higher comes at 200 and 201.40 with a Fibonacci extension at 202.78 and a Measured Move to 210. Consolidation with a Chance of Pullback in the Uptrend.
Heading into September Options Expiration Week the equity markets look tired and ready for a pullback. Elsewhere look for Gold to continue lower while Crude Oil does the same. The US Dollar Index is strong and looks to continue higher while US Treasuries are biased lower. The Shanghai Composite is also strong and biased higher with Emerging Markets looking to continue their pullback. Volatility looks to remain subdued keeping the bias higher for the equity index ETF’s SPY, IWM and QQQ. Their charts show more consolidation in the zone for the IWM and a possibility of consolidation or even a pullback for both the SPY and QQQ. Use this information as you prepare for the coming week and trad’em well.
See the original article >>
No comments:
Post a Comment