by Greg Harmon
Palladium has been a metal on a mission. It has steadily risen throughout 2014 while Copper, Gold, Platinum and Silver have languished at best. But can it continue? The chart has some mixed messages. Take a look.
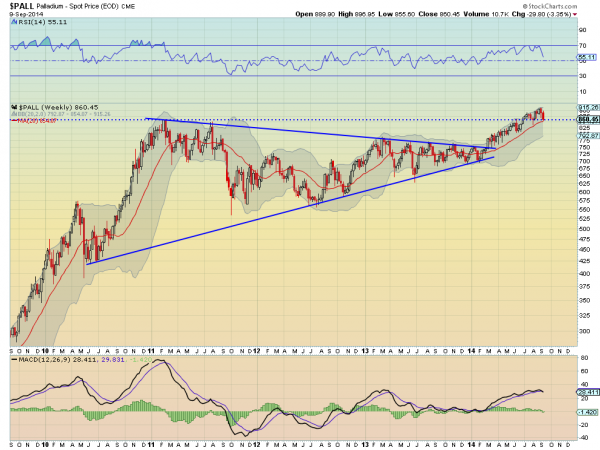
The weekly chart above shows that the move higher in February broke out of a 3 and a half year long symmetrical triangle. The target for the move higher out of this pattern would be to about 1190, a far cry from where it is trading now near 860. So why the concern? First, the triangle break happened deep into the apex. The power zone for a break higher tends to be about 2/3 of the way through the triangle and this is closer to 90%. This often leads to a weak move higher. The momentum indicator, RSI, is also making a new lower low on this pullback, and the MACD is about to cross down, a bearish trigger.
But I said it has mixed messages. What about the positives. First there is that target of 1190 higher. Next, if the RSI were to move back up before the price broke the August 4th week low then a Positive RSI Reversal would trigger and target a new high. The 20 week SMA rising in red has been support for this move higher and it has not broken that yet. Finally the price is consolidating over the prior high from February 2011 and it can be expected to take some time to move away from that.
So what do you do? I am watching the 20 week SMA and a break of support could trigger a sell or short position with a target of the center of the triangle near 725. A move back higher over 910 could trigger a long position. This metal can be traded using the ETF $PALL, but I would stick to using the commodity price levels as your guide for entering and staying in the trade.
No comments:
Post a Comment