by Elliott Wave Theory
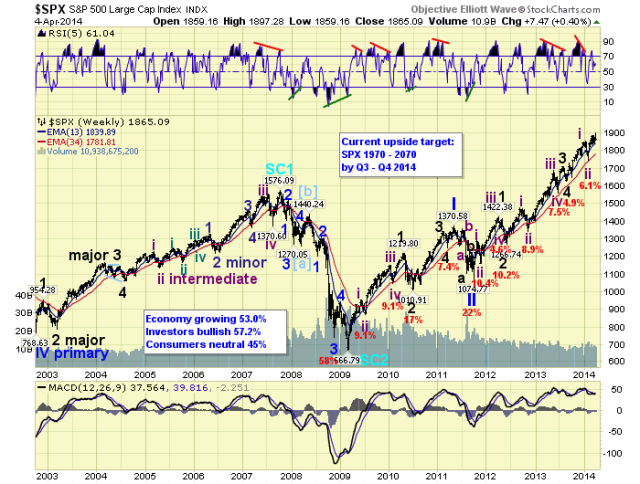
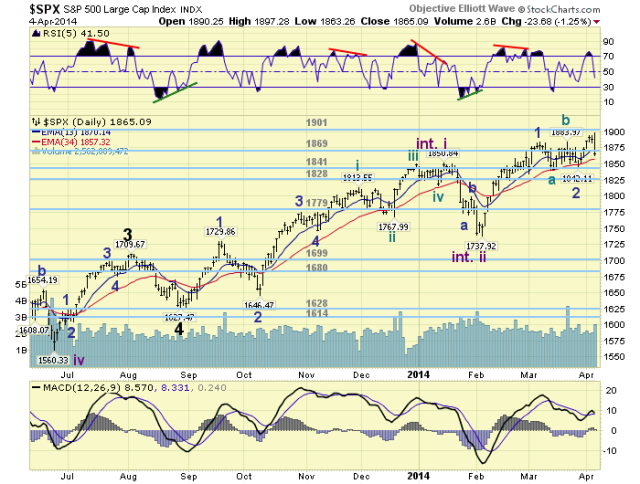
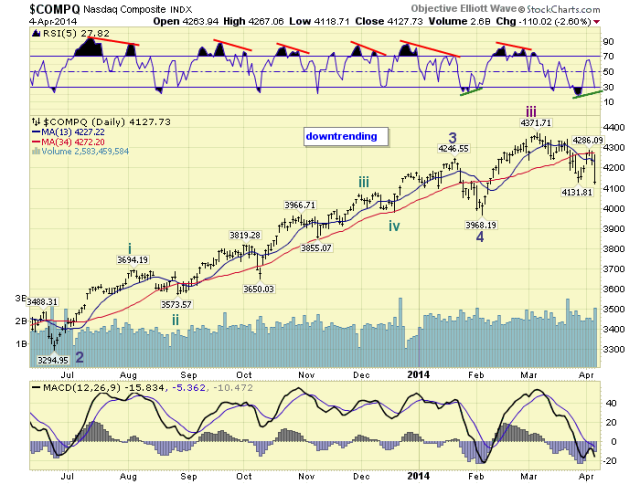
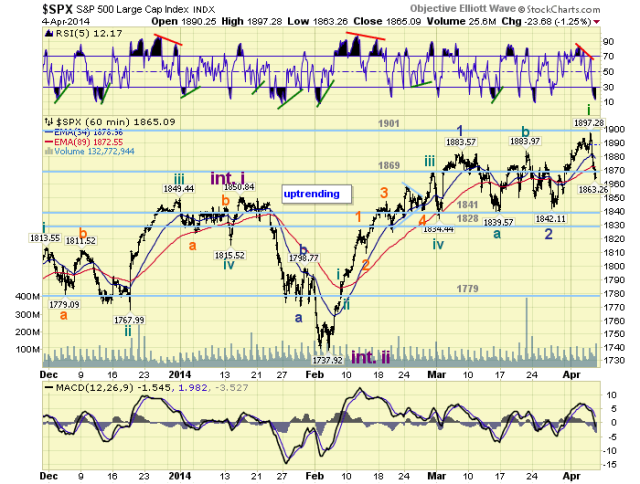
| REVIEW Interesting finish to quite a positive week. The week started off by gapping up Monday/Tuesday and hitting a record high. Wednesday/Thursday also produced record highs, and the DOW made an all time high too. The NDX/NAZ, however, came under selling pressure at the open on Thursday, and remained under selling pressure into Friday’s close. The SPX/DOW gapped up to new highs early Friday, but then gave way ending the week with moderate gains. For the week the SPX/DOW were +0.5%, the NDX/NAZ were -0.8%, and the DJ World index rose 1.0%. Economic reports for the week were again mainly to the upside. On the uptick: ISM manufacturing/services, construction spending, auto sales, the ADP, factory orders, Payrolls, the WLEI and Investor sentiment rose. On the downtick: Chicago PMI and the monetary base, plus weekly jobless claims and the trade deficit rose. Next week we get the FOMC minutes, Export/Import prices and the PPI. LONG TERM: bull market The US bull market is currently five years old. Historically, since 1885, there have only been four other bull markets of this duration or longer: 1921-1929, 1932-1937, 1987-2000 and 2002-2007. When we reviewed the previous two 5 year bull markets we observed they were quite similar in wave structure: waves 1 thru 4 took two years, and wave 5 took three years. This bull market does not look like either of them. Actually its wave structure currently looks more like the 1921-1929 bull market: wave 1 two years and wave 3 three years. However, since this bull market has had a tendency to truncate fifth waves, the structure alone is not considered enough evidence to anticipate a potential 8 year bull market. So we dug a bit deeper. What we uncovered was quite interesting. Each of the previous four lengthy bull markets were quite oversold during their fourth wave, except for 2002-2007. In each of the other three bull markets their fifth waves then lasted for another two-three years. Currently our bull market is still in the process of completing its third wave: Primary III. When the fourth wave does arrive we will likely be able to determine if the fifth wave, Primary V, will end this year or extend into 2017. The key, of course, is the wave structure, and the extent of the Primary IV selloff. If during Primary IV the market loses substantially less than 20% of its value, Primary V will likely be short lived. If during Primary IV the market loses 20% or more of it value, Primary V is likely to extend for another three years. Then we would have an eight year Cycle [1] bull market instead of five years. As a result we have upped our Q3 – Q4 target of SPX 1970, to SPX 1970 – 2070. It is still too early to tell if it will end the bull market, or just end Primary III. Stay tuned. MEDIUM TERM: uptrend Last weekend we noted the market had hit an interesting juncture and offered the following. Currently we see three potential scenarios, in order of preference, short term. One: the NDX/NAZ confirm a downtrend next week, bottom within a few days, then all four major indices are aligned for the next wave up. Two: the NDX/NAZ is currently bottoming, with no downtrend confirmation, and all four major indices remain out of sync for the next wave up. Three: the situation in Ukraine/Russia worsens resulting in a panic selloff in equity markets, and all four major indices realign at the early February lows. The market opened the week like it was taking on scenario number two. The NDX/NAZ began to rally and the SPX/DOW rallied to all time new highs. At the open Thursday, however, the NDX/NAZ started to selloff again and by Friday’s close had reverted to scenario number one. Interesting week! Currently we have the NDX/NAZ in confirmed downtrends, and the SPX/DOW still in uptrends. This suggests, despite Friday’s sharp decline, the four major indices are trying to realign for the rest of Primary III. Currently we have the NDX/NAZ in Intermediate wave four downtrends. When this downtrend completes these indices will still need two more uptrends to end Primary wave III: Major wave 3 and Major wave 5. The SPX/DOW are more advanced as they are already in Major wave 5. But their Major 5 is subdividing into five Intermediate waves. Currently they are in Intermediate wave iii, and require another uptrend after this one to complete Primary III. Should the NDX/NAZ reverse next week and enter an uptrend without the SPX/DOW entering a downtrend they will realign. Then the four major indices can complete their trends in unison to end Primary III. Yes, it is a bit confusing since these indices are unfolding in different wave patterns. But the potential alignment is now setup. All we need is for the NDX/NAZ to reverse and start uptrending early next week. Medium term support is at the 1841 ad 1828 pivots, with resistance at the 1869 and 1901 pivots. SHORT TERM Short term support is at the 1841 and 1828 pivots, with resistance at the 1869 and 1901 pivots. Short term momentum ended the week extremely oversold. The short term OEW charts are negative with the reversal level now SPX 1879. We have been counting this uptrend, since early February at SPX 1738, as Intermediate wave iii. Thus far it has completed Minor waves 1 and 2 at SPX 1884 and 1842 respectively. The recent rally to all time highs at SPX 1897 should be Minute one of Minor wave 3. And Friday’s decline to SPX 1863 should be all, or most, of Minute wave ii. We counted five waves up from SPX 1842 to 1897: 1867-1853-1894-1883-1897. Since the fifth wave was the shortest in the structure, and it ended in a diagonal triangle on the one minute chart. It was not too surprising to see Fridays pullback go below the start of the first wave (1867). Pullbacks are usually fairly steep when fifth waves are short. On Friday the SPX dropped from the OEW 1901 pivot range (1894-1908) to the OEW 1869 pivot range (1862-1876) which is currently creating support. With the short term momentum extremely oversold the market should experience at least a bounce quite soon. The down trending NDX/NAZ are also displaying a positive RSI/MACD divergence at Friday’s low on their hourly and daily charts. In the past this has usually led to an uptrend. While Friday’s selloff looked quite nasty, it may be quite positive longer term. However, should the SPX continue to decline and break below the OEW 1841 pivot range (1834-1848) it will likely be in a downtrend as well. Next week we will be watching the NDX/NAZ for signs of a reversal, plus the 1869 and 1841 pivots. FOREIGN MARKETS The Asian markets were mostly higher on the week for a net gain of 1.3%. The European markets were also mostly higher on the week for a net gain of 1.6%. The Commodity equity group were all higher on the week for a net gain of 2.5%. The DJ World index is still uptrending and gained 1.0% on the week. COMMODITIES Bonds remain in a downtrend and lost 0.2% on the week. Crude remains in an uptrend but lost 0.6% on the week. Gold is also in a downtrend but gained 0.6% on the week. The USD is uptrending again and gained 0.2% on the week. NEXT WEEK Monday: Consumer credit at 3pm. Wednesday: Wholesale inventories and the FOMC minutes. Thursday: weekly Jobless claims, Export/Import prices, and the Budget deficit. Friday: the PPI and Consumer sentiment. As for the FED. Tuesday: Congressional testimony from General counsel Alvarez, and a FED board meeting right after the close. Wednesday: a speech from FED governor Tarullo in the evening. Sunday afternoon: a speech from FED governor Stein. Busy week for the FED and likely for the markets too. Enjoy your weekend and week! |


No comments:
Post a Comment