by Greg Harmon
Technical Analysis is best noted for looking at previous price action to see where a stock might encounter some resistance or support based on past history. This can either be from actual price battles at those levels or naturally pleasing ratios (Fibonacci ratios) on partial retracements. But when price reaches new highs that all can become useless and new forms of Technical Analysis are needed to project higher.
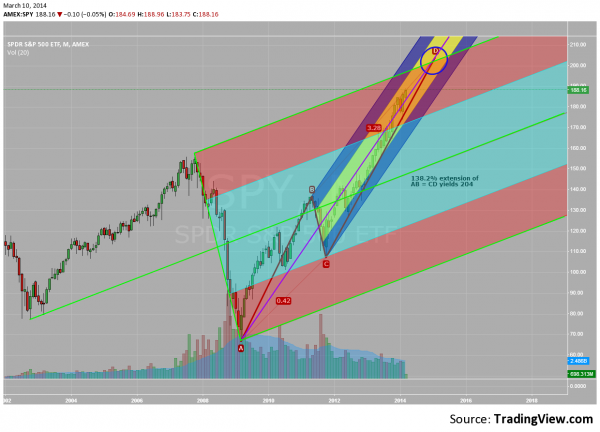
The chart below looks at 3 different projections that intersect at the same spot in the SPDR S&P 500 ETF, $SPY, at about 204. The first two are using Andrews’ Pitchforks. The SPY is fast approaching the Upper Median Line (UML) of the green outlined Pitchfork that goes back to the October 2002 low. The SPY is also riding the purple Median Line (ML) of the smaller pitchfork higher, not straying outside of the yellow area. No where near the mid line between that and the Upper or Lower Median Lines. Price does not have to continue on these paths, attracted to the green UML and riding the purple ML, but if it does they will cross at about 204. What makes that point a little more interesting is that it is also important to the AB=CD harmonic formation. You can see without measuring that the CD leg is already longer than the AB leg, but the CD leg often extends at a Fibonacci ratio. In this case as drawn, the D point at about 204 would be a 138.2% extension of the AB leg. Three ways to build a mosaic that reaches 204. This means that 3 different types of traders with 3 different timeframes will be looking at that level as significant. Shouldn’t you too?
No comments:
Post a Comment