By: Gregor_Horvat
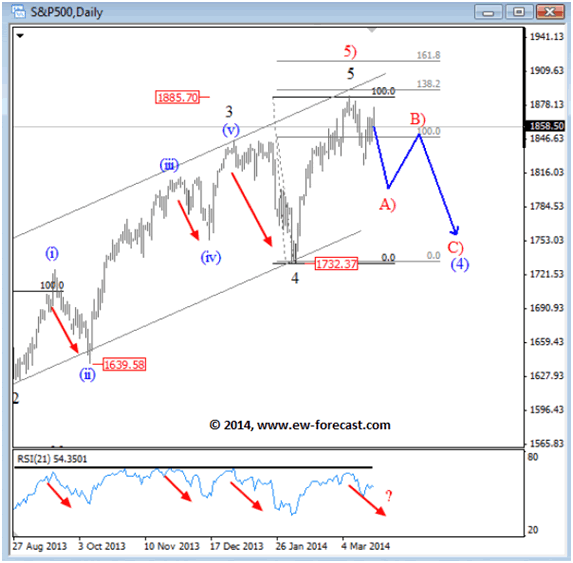
&P500 Daily: wave five reversing from resistance zone
S&P500 has been in bullish mode since February but it looks like that the direction of a trend could be changing now after a rally up to 1880/1920 Fibonacci and channel resistance area, where we see zone for a completed fifth wave in wave 5) of (3). So far, market is reversing nicely down with a weekly close price at 1839 so we suspect that market will continue to the downside now for a three wave pullback down in blue wave (4). We are also looking at the RSI that is reversing from 60/70 area that can be signaling for a bearish pullback, similar like in the past few months.

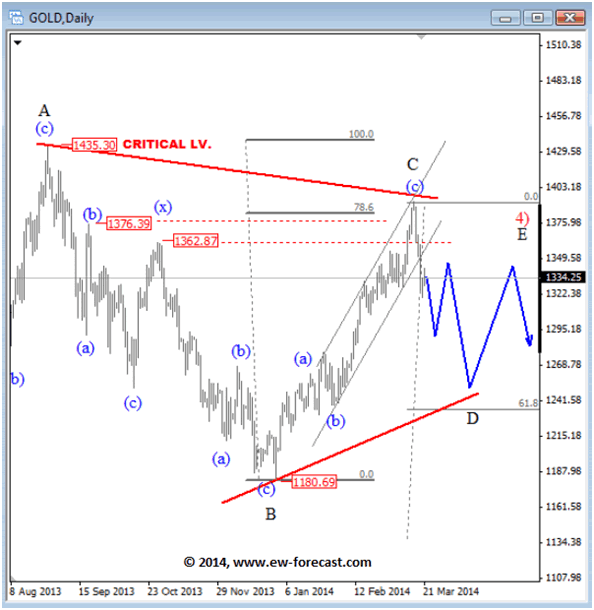
GOLD Daily: triangle; now wave C down
On Gold we presented you a triangle idea few weeks back, with wave C rally up to 1380/1400 resistance area. Market sold of sharply from that levels last week and it seems that price is ready to continue lower in the next few days and weeks as current decline looks impulsive on the intraday basis. With that said, we suspect that wave D is now underway that may reach revels even around 1240/1270.

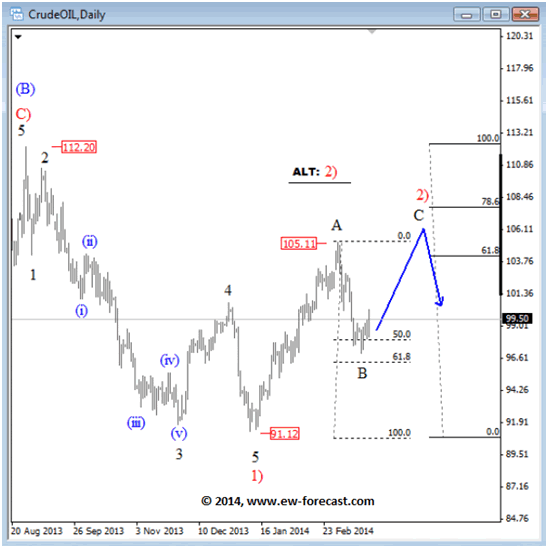
OIL Daily: wave B at the support zone
Crude oil turned bearish as expected in March after hitting 105.00 level where we see a completed wave A, so current leg down is most likely wave B that may form a new based for this market around 61.8% retracement level. A bounce from that zone, in impulsive fashion, will put wave C in play for rally up to 106.00 area to completed wave 2).
Further weakness from current levels and down to 94.00 in impulsive fashion will suggest an early reversal in trend of crude oil. In that case we would put alternate count in play; completed wave 2) 105.10.

No comments:
Post a Comment