by Greg Harmon
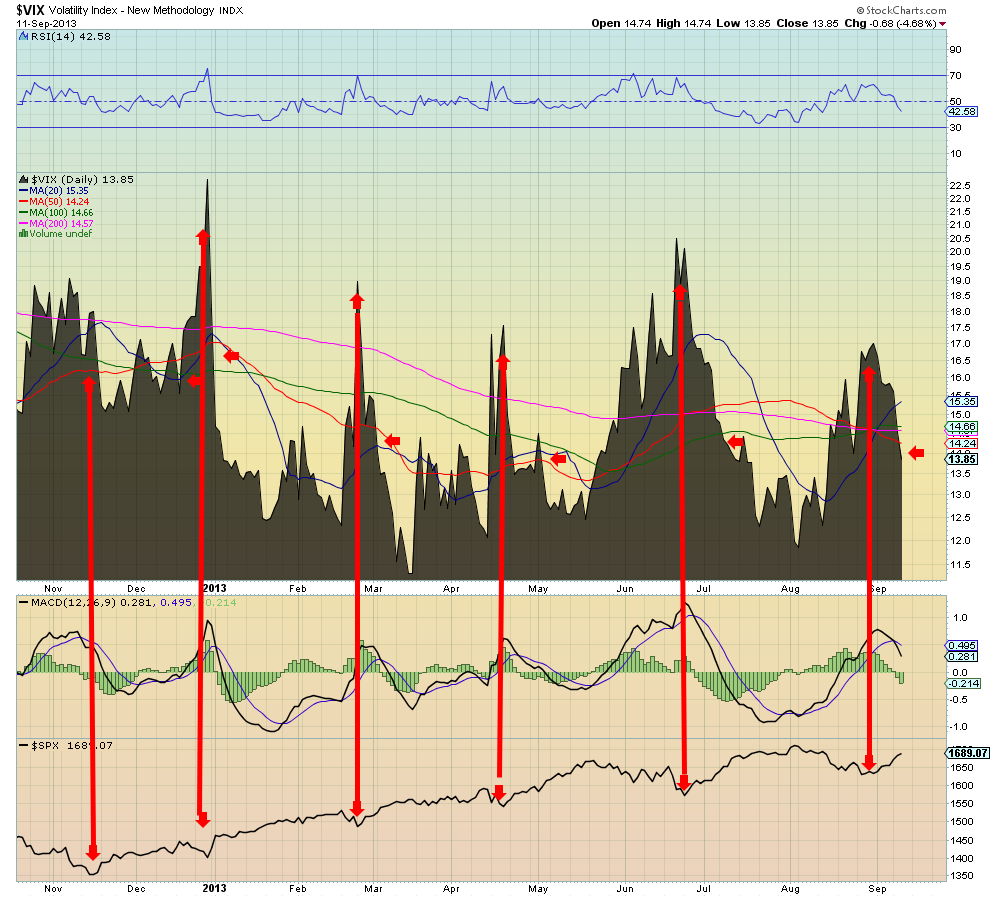
All of the indicators have been lining up, compounding the bull case. Another one will print today. The Volatilty Index, $VIX, is one we starting following more closely earlier this year. I first wrote about it as a market indicator, not a risk indicator, in April in The Spike in the Volatility Index Points to Higher Stock Prices. Since then it has held true to form. The basic premise is that a spike in the VIX over all of the simple Moving Averages on the daily chart (20, 50, 100 and 200 day) followed by a reversal lower under all of them, and confirmed by a MACD cross lower, signals a bottom has formed in the S&P 500, $SPX, and that new highs are on the way. This has happened the last 7 times it has occurred (first was confirmed December 13, 2011). With a close under the 50 day SMA at 14.24 today, it triggered for an 8th time. This is of course no guarantee for the market to make another new high, but it should also not be ignored, especially along with all the other technical evidence the market has been showing us.
No comments:
Post a Comment