The Double Bottom is a reversal price pattern & is very common seen in all markets, instruments, time frames, & price ranges. It presents with the immediate background environment as bearish with down-trending price action. The classic Double Bottom can be an indication that the downtrend is losing strength & may possibly be the end of the decline in prices. The Double Bottom Reversal usually marks an intermediate or long-term change in trend & is therefore considered to have a definite bullish bias.
Visually the Double Bottom pattern presents two consecutive minimums in price, ‘valleys or troughs’ that are roughly equal with the requirement of a moderate peak or swing high in-between. The price level of this swing high establishes what is called a ‘neckline’ & creates the immediate resistance for the pattern. Traders often refer to this pattern resembling a ‘W’.
Note that in the downtrend there may be many potential double bottoms in price along the way down, but until significant resistance is broken, a reversal cannot be confirmed & traders should respect the trend.
Key points to formation:
- Background: price action trending Down
- 1st trough: marks lowest price point in the current trend
- 1st swing high effort: buyers step in & advance price typically to a significant price area also seen in the background downtrend action. This 1st effort establishes the immediate overhead resistance & defines a ‘neckline’. Volume on the advance is often large holders taking profits (‘buy to cover’) & may be inconsequential, but an increase could also signal early accumulation.
- 2nd trough: the decline off the resistance usually occurs with low volume. Support at the previous low is the expectation & aggressive traders will look at volume activity for early signs from the bulls. Note that there is NO confirmation of a reversal of trend at this point. The time period between troughs can vary but typically they are in-line with the symmetry of the instrument of choice. The 2nd low may offer a perfect double bottom in price but the ‘textbook’ range for price is acceptable within 3% of the 1st trough price.
- Advance from trough: Traders are looking for volume & buying pressure with the lack of sellers to accelerate off of the 2nd trough. The type of activity seen in volume during the effort back to resistance is an indication of strength or weakness. Pattern must have a minimum of 2 swing low efforts creating support & 2 swing high efforts creating resistance.
- Resistance break: even after trading back up to resistance a trend reversal is not complete. Breaking the resistance of the highest swing high price effort of the pattern & with conviction seen in volume completes the Double Bottom Reversal.
- Resistance turns into support: broken resistance becomes potential support. Often but not always, there is a test of this newly created support & this effort offers a final consideration for a long entry into a potential change of trend.
- Price target: measured move of pattern size. Distance between swing low & swing high of reversal pattern added to breakout line. This spread in price is an implication of the potential for an advance.
While this pattern is fairly straightforward it should be noted that traders often ‘jump the gun’. Not all repeated lows produce a change of trend & traders need to remember that the trend is in force until proven otherwise. Bottom formations can take some time and patience is often a virtue. If a trader will give the pattern time to develop and look for the proper clues & then follow the guidelines, this chart pattern can be well-worth the effort of identifying & trading it.
Options for Trading the Double Bottom as a bullish reversal pattern:
There are 4 methods of trading this pattern & it depends on your trading style.
Most Aggressive traders will be looking for the 2nd trough in price as soon as the first trough shows buyer support & the swing high is in place. As the action comes back to re-test this low support area aggressive traders will be diligently monitoring the volume action looking for clues to the buying pressure. Entries in this area can work with a stop placement just below the lowest low of the formation. Aggressive traders should be prepared for capitulation selling or ‘dump & run’ type price action.
Aggressive traders may wait until a 2nd swing low is made & then monitor the action thru the middle of the reverse pattern. The concept of this option is to identify the reversal price action as being contained in a support/resistance ‘box’. Traders monitor the middle ‘muddy trench’ or 50-50 of the spread in price offered by the pattern for an entry once the bulls control. Stop placement can be fairly tight just below the trench zone. An additional option to add to this set up is to include waiting for 2 solid efforts on resistance & then consider the muddy trench zone entry. This can be an accurate trade offering an entry looking to capitalize on a breakout & potentially a new bullish trend but without the risk of the most aggressive option.
Classic traders will look for a long entry with the breakout of the neckline or immediate pattern resistance. Stop placement right below the neckline price.
Conservative traders will watch the breakout & look for a re-test of that new breakout support price to hold for full confirmation of the double bottom reversal pattern. Stop placement right below breakout price. Note that this method of waiting for this pullback may or may not offer an opportunity but statistically it has a high % of success when it does present.
The aggressive trading methods can highly increase the profit potential of any Double Bottom & may offer more than one entry. However, the trader needs to assess whether the ‘extra’ profits choosing an earlier entry offers a decent risk:reward over waiting for some confirmation of action based on clearing a defined price resistance. Traders choosing these options should look for strength from buyers in combination with the lack of sellers. It cannot be stressed enough that volume is a major key & an expansion of bullish volume aids confirmation.
False breakouts do happen & confirmation needed is always a traders’ choice. Several methods that apply here for either intrabar &/or close bar options offered in sequence: breakout above resistance price, retrace holds new support line, price clears breakout swing high price, price clears next swing high of background downtrend price action, larger chart combination.
Stop placement considerations for all trade entry choices can be aggressively raised after the breakout of the price.
Measured Move Target based on structure of the Double Bottom Reversal Pattern
- Double Bottom Pattern measure (added to) BreakOut price = target
- Double Bottom Pattern measure = (swing high price of pattern (minus) swing low price of pattern)
Since the Double Bottom Reversal Pattern once confirmed has such a high degree of success indicating a change of trend, there are additional target considerations based on the knowledge that history repeats. All traders can look for tests on each of the swing highs seen in the immediate background downtrend price action. At any point & for all of these options, traders should gauge the continued conviction of the bulls based on momentum. If momentum is strong stick with the trade, if they get ‘lazy’ then consider taking profits & possibly look for a re-entry.
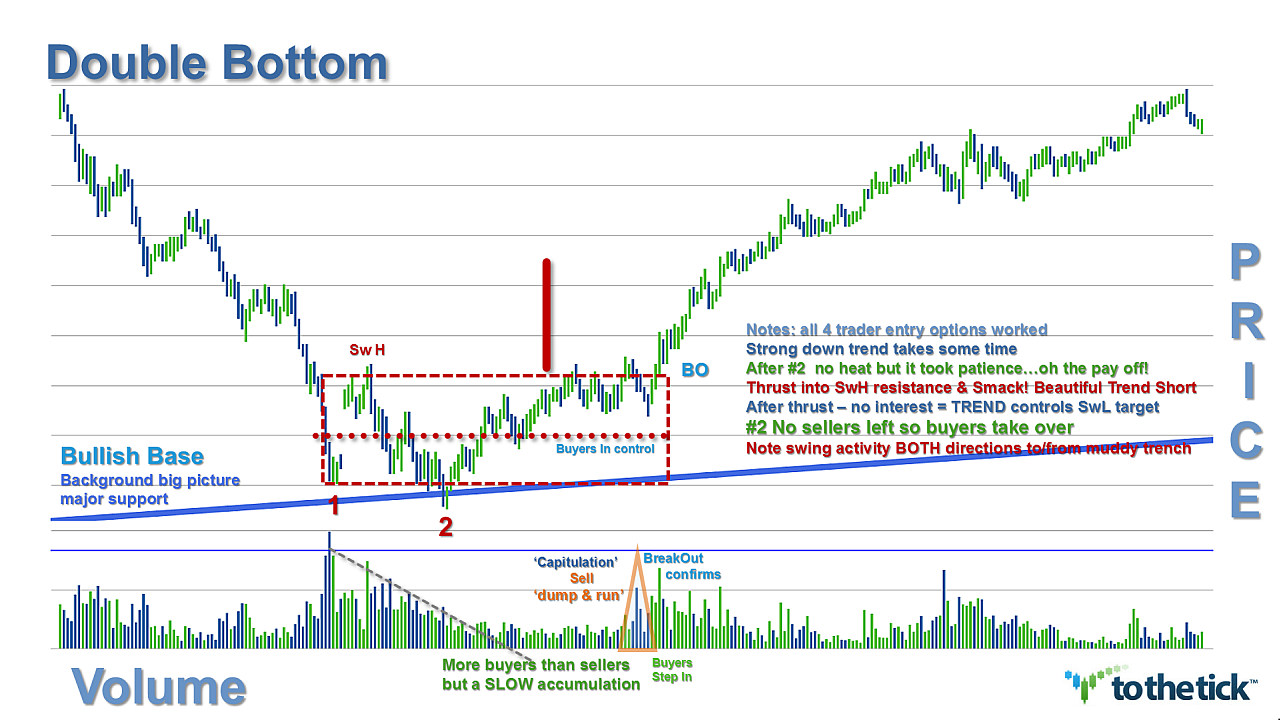
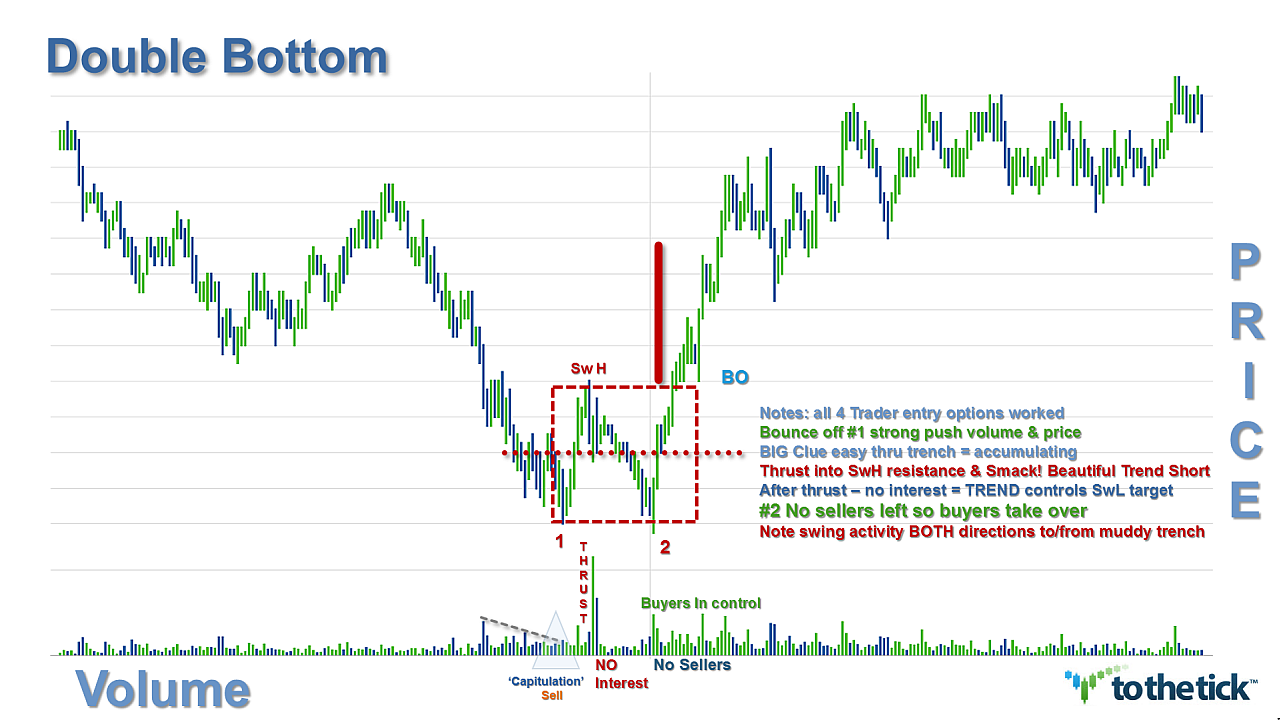
Examples: Double Bottom Reversal Pattern
No comments:
Post a Comment