by Greg Harmon
Last week’s review of the macro market indicators suggested, heading into the first full week of July saw the markets improving and possibly ready to move higher again. We looked for Gold ($GLD) to continue its downward move or consolidate in a broad range while Crude Oil ($USO) continued higher. The US Dollar Index ($UUP) also looked to continue to the upside while US Treasuries ($TLT) resumed their move lower. The Shanghai Composite ($SSEC) might continue its bounce in its downtrend, but the Emerging Markets ($EEM) were biased to the downside. Volatility ($VIX) looked to remain low and drifting lower keeping the bias higher for the equity index ETF’s $SPY, $IWM and $QQQ. Their charts showed that the IWM was the strongest and ready to continue higher while the SPY and QQQ still had some resistance to work through in their short term moves higher before they were in the clear to move higher.
The week played out with Gold deciding it did not like those choices as it moved higher while Crude Oil also moved up, before consolidating to end the week. The US Dollar met resistance and broke lower while Treasuries consolidated under resistance. The Shanghai Composite started higher out of consolidation while Emerging Markets jumped and held their gains. Volatility continued to fall back to lower lows creating a bullish environment. The Equity Index ETF’s responded by moving higher with IWM making new All-time highs, the QQQ new 13 year highs and the SPY closing in on a new high as well. What does this mean for the coming week? Lets look at some charts.
As always you can see details of individual charts and more on my StockTwits feed and on chartly.)
SPY Daily, $SPY 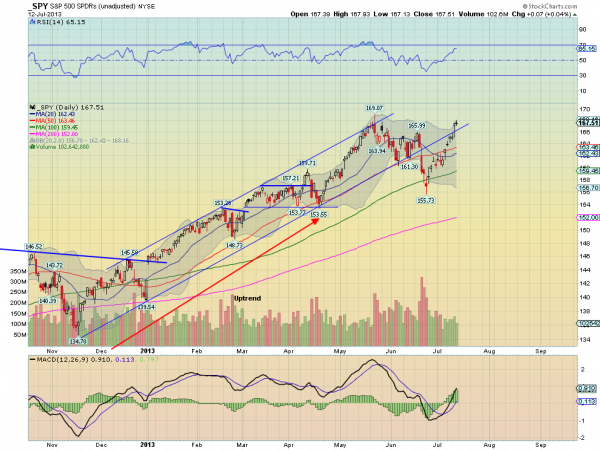
SPY Weekly, $SPY 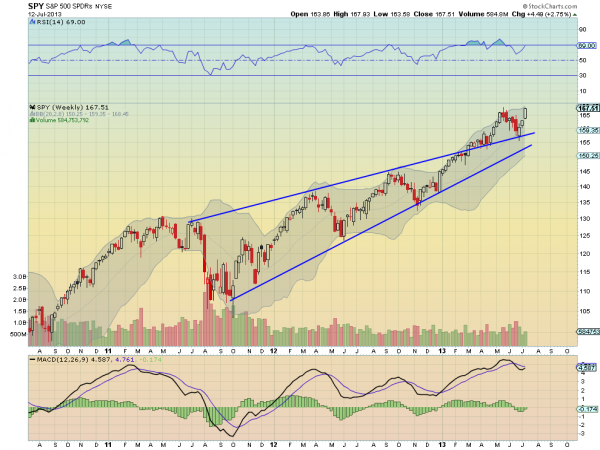
The SPY continued the move higher over the Simple Moving Averages (SMA) and the trend support/resistance line from the November low. It has the look of a possible Shark Harmonic but the low at 155.73 went beyond the 161.8% limit of the extension lower. The week ended with a Doji Star, signaling indecision, just below resistance at 168. The Relative Strength Index (RSI) on the daily chart is rising and bullish and the Moving Average Convergence Divergence indicator (MACD) is also rising and bullish. Out on the weekly chart the strong white candle is watered down a bit by the gapping nature of the rise, looking like an Advance Block than 3 Advancing White Soldiers. A potential trend exhaustion. The RSI is moving higher though and so is the MACD so there is a bullish bias. There is resistance at 168 and 169.07 before free air and new all-time highs. An extended RSI Positive Reversal could see it hit 171.25 above that. Support lower comes at 166 and 163 followed by 161.60. Continued Upside With a Possibility of Consolidation.
Heading into next week, the markets look strong but maybe a bit extended. Look for Gold to continue higher in the downtrend while Crude Oil slows at resistance in the uptrend. The US Dollar Index looks to continue lower along with US Treasuries. The Shanghai Composite and Emerging Markets are biased to the upside in their downtrends and have potential to reverse those trends with continued strong moves. Volatility looks to remain low and drifting lower, keeping the bias higher for the equity index ETF’s SPY, IWM and QQQ. All are biased higher with the QQQ looking the strongest the IWM and SPY perhaps extended a little in their uptrends. Use this information as you prepare for the coming week and trad’em well.
No comments:
Post a Comment