
The Bear Flag is considered one of several price action patterns that lead to a continuation of the bearish trend. Typically they present immediately following an impulsive move in the market & represent a short consolidation before the continuation of the trend. In general Flags are found frequently in all markets, time frames, & price ranges. They also tend to be easy to identify, very reliable & therefore, a trader favorite.
Visually Flags are a 2 part structure: a Pole with a base & a tip tilted toward price & then a small parallelogram or rectangle attached to the Pole tip facing right. In the case of a Bear Flag it looks like an up-side-down Pole with the tip at the bottom.
They are characterized with parallel or near-parallel trend lines drawn to represent the immediate support & resistance. Ideally the Bear Flag portion will be ‘tilted’ or sloped upwardly opposite of the prevailing trend direction during formation which is believed to offer traders a potential ‘edge’. However, a good Bear Flag is not limited to have a tilt as it can also be totally horizontal, or even sloped downward representing ‘nuances’ for traders to consider.
The bearish continuation pattern has 3 phases:
1) Background: A Strong impulsive, thrusting action with a surge in volume & price establishes a clear picture of the controlling bearish trend direction. This action is represented visually by a Pole with tip pointing down. Deeper & more drama the better as the Pole is the Key to recognizing the potential for the continuation of the pattern. The Pole represents trend direction as well as its strength & often this pattern is initiated as a new breakdown in price from an established area & sellers are in control. This pattern has ‘1 rule: all Flags must have a pole.’
2) The second phase is a pause for consolidation of the action both in volume & price and is represented by the Flag. As traders we like to see this phase very short in duration with only 2 or 3 swings while our price action is range bound maintaining the parallel or near-parallel shape & the volume is ‘resting’.
- Usually the difference between Flags & Rectangles &/or Channel price patterns is their size or duration. Typically, Flags are relatively short in duration and therefore small.
3) The pattern confirms as a bearish continuation pattern if the action creates a new bearish breakdown with a surge again from the bears in both volume & price. The immediate lower support outlined by the Flag is the area traders look to see confirm the breakdown. Typically the action will mimic the volatility & energy experienced with the Pole creation.
Options for Trading the Bear Flag as a bearish continuation pattern:
Aggressive traders may trade short:
- with each failed swing high effort on resistance: recommend wait for couple of swings
- less aggressive option: wait for the 1st confirmed failure of price to make it back to the upper resistance line
Conservative traders will enter a trade short:
- once the lower support line has been broken
- once the new breakdown has confirmed
False breakouts do happen & confirmation needed is always a traders’ choice. Several methods that apply here for either intrabar &/or close bar options offered in sequence: breakdown below support price, line holds retrace as new resistance, price clears breakdown swing low price, price clears Pole tip price, larger chart combination.
Stop placement considerations can be aggressively lowered after the breakdown of the price.
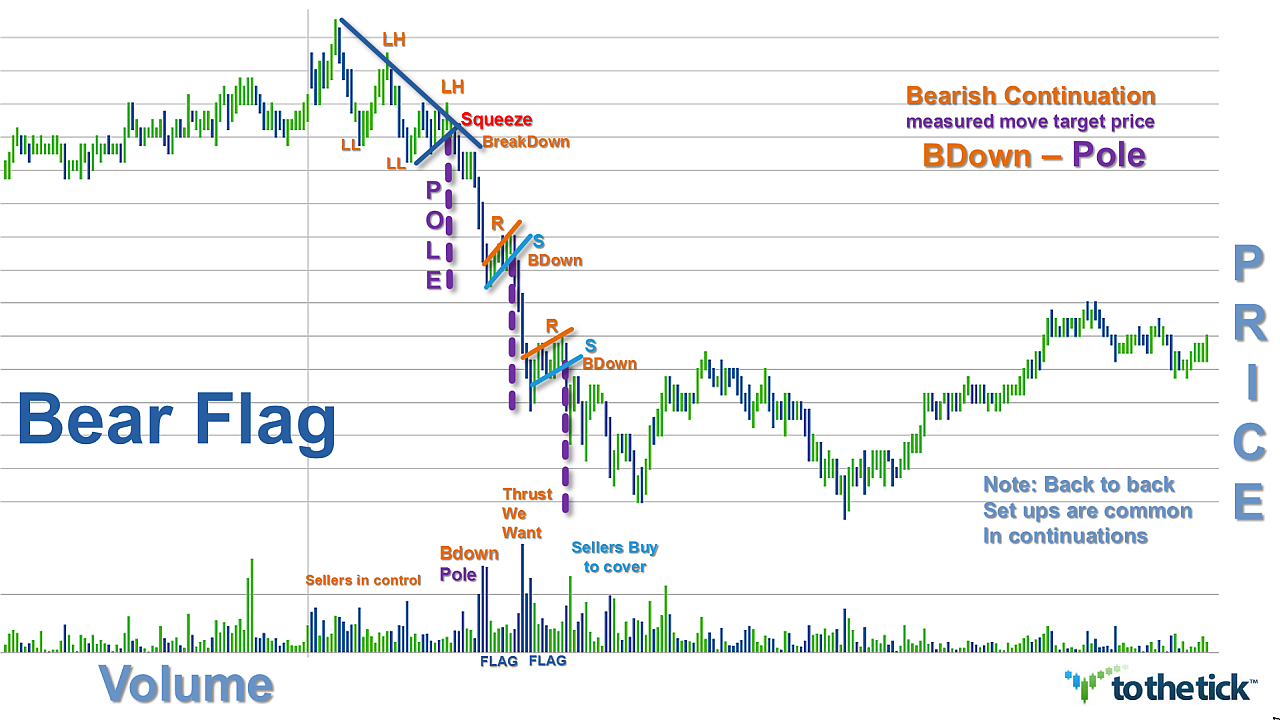
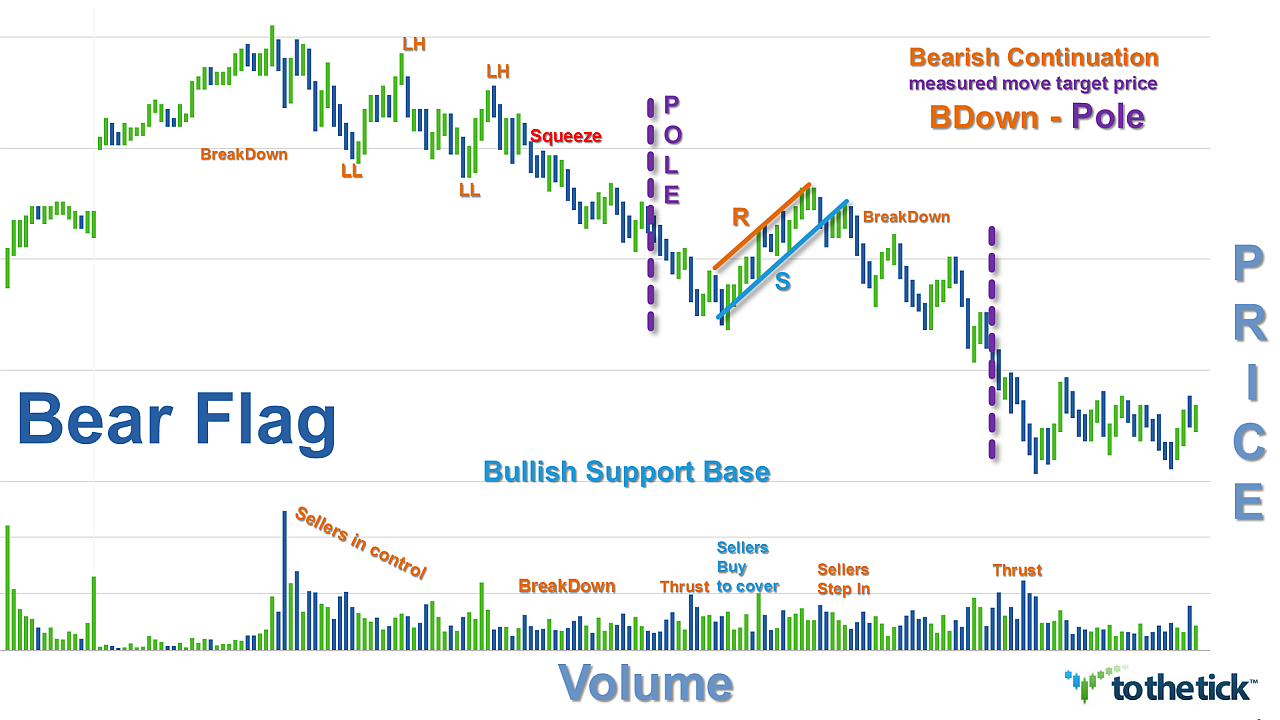
Measured Move Target based on structure of Pole & the Bear Flag
Aggressive with Momentum & Volume: duplication of the original move or trader choice measurement of the Pole:
- BreakDown price (minus) Pole measure = target
- Pole measure = (Pole Base price (minus) Pole Tip price)
Examples Bear Flag as a bearish continuation pattern:
No comments:
Post a Comment