By Lance Roberts
I have been very vocal since the beginning of June that now is a great time to be adding bonds to portfolios. (See here and here) There are several fundamental reasons for my belief that the recent rise in interest rates was more related to a short term liquidation cycle rather than a shift in global economic sentiment.
1) Domestic economic strength remains very weak (growing at just 1.8% annually since 2000)
2) Four years into the current “recovery” the economy is already past the average length of most growth cycles. Interest rates fall during down cycles.
3) Geopolitical unrest makes U.S. Treasuries an attractive “safe haven” for foreign capital flows.
4) Global economic weakness (China, Euro-zone and Japan) will likely drive buying of U.S. Treasuries.
5) Upcoming “debt ceiling” and budget debate in September likely to drive inflows into the safety of bonds as we saw in 2011.
6) If the Federal Reserve begins to extract liquidity by slowing bond purchases – financial markets are likely to come under selling pressure pushing money flows from equities into bonds.
7) Declining rates of inflation which are representative of economic weakness.
8) Ultra-low interest rate policies by the Fed continue to push investors to seek yield over cash. The recent rise in rates makes bond yields much more attractive.
However, even if you disagree with the fundamental arguments, it is hard to argue against one of the most compelling reasons for buying bonds which has 35 years of history supporting it. I discussed this particular reason during a Fox Business interview recently stating that:
“Interest rates are now 4-standard deviations above their long term moving average.”
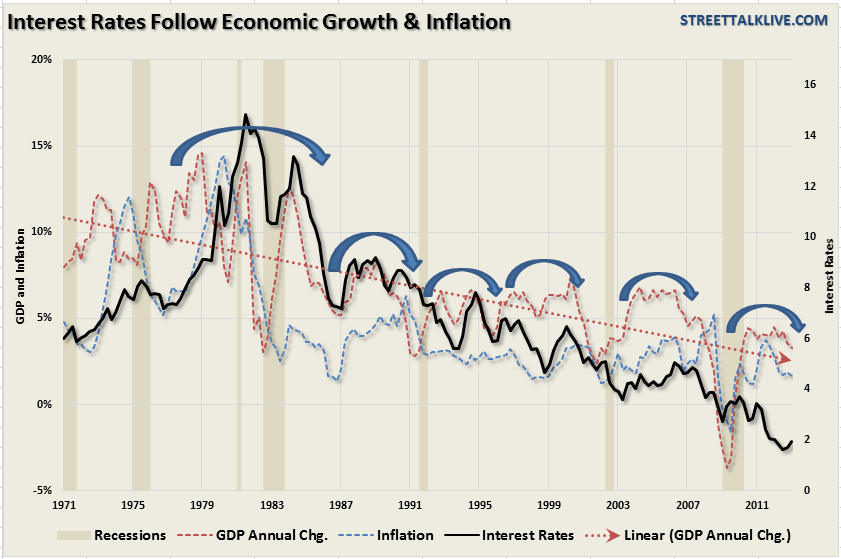
As shown in the chart below the driving force behind the long term decline in interest rates has been the ongoing slide in both economic activity and inflationary pressures. Interest rates track the direction, and trend, of economic activity as does inflation. Less demand in the economy leads to declines in prices (deflation) and interest rates.
There are two important things to take away from the chart above. The first is that, as I have notated with blue arrows, is that each time interest rates have spiked it has led to a peak in economic activity. You can already see that economic growth has peaked for the current economic cycle which has led to a subsequent decline in inflationary pressures. Secondly, most of the commentary surrounding the reason that rates are on track to go higher is based on the the similar spike seen in 1994. First, that spike in rates led to a sharp slowdown in economic activity and rates quickly fell. Secondly, the economy was in the midst of a secular growth cycle due to the “Internet/financial boom” which currently does not exist today.
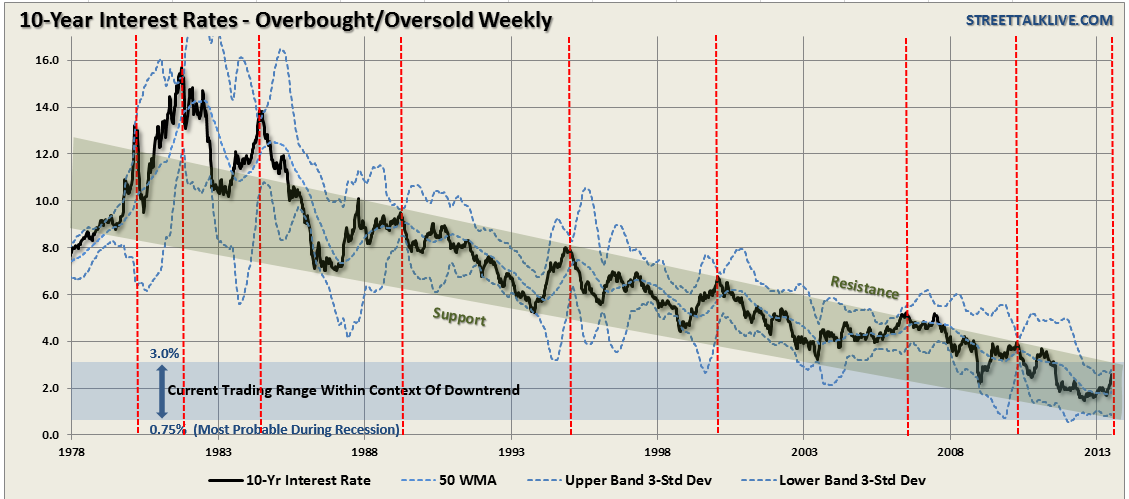
The next chart, however, is the “technical” reason as to why I think now is the time to start acquiring bonds. Again, you can argue the fundamental story, depending on how you want to selectively build your economic “case”, however, it is difficult to argue with 35 years of interest rate history. The chart below shows the 10-year treasury rate on a weekly basis with bands set at 4-standard deviations above and below the 50-week moving average. The green shaded area is the current downward trend that has remained intact post the interest rate spike in the late 70′s.
What is important to notice is that there have only been a few times in history that rates have gotten to 4-standard deviations above the long-term moving average. Every single time, as noted by the vertical red dashed lines, such extreme movements in rates has been a peak in rates for the intermediate term. Most recently these extreme spikes were witnessed prior to the recession following the “technology bubble” in 2000 and the “housing bubble / financial crisis” in 2008.
The blue shaded area at the bottom of the chart shows the current range of interest rates that are likely to occur given the context of the downtrend. The peak of that range is 3% on the 10-year treasury and the bottom of that downtrend would suggest rates on the 10-year during the next recession to fall below my current estimate of 1%.
There are many reasons to own bonds in portfolios as they have a capital preservation function by returning principal at maturity, creating an income stream and lowering portfolio volatility. However, there are three reasons to add bonds to portfolios currently:
1) As discussed recently investors tend to do the opposite of what they should investment wise by panic selling market bottoms and buying market tops. Currently, unlike the stock market which remains extremely overbought on an intermediate term basis, bonds have had a substantial correction in price which now makes them technically very attractive in the short term for a trading opportunity.
2) The “quest for yield” isn’t over as long as the Federal Reserve continues to keep “accommodative rate policies” in place that keep money market rates near zero. With “baby boomers” rapidly heading into retirement, following two nasty bear markets that took away 50% of wealth, the allure of “safety” and “income” are the keys to their current psyche.
3) Money flows into U.S. Treasuries will likely increase as the slowdown in European, and Asian, economies seek safety and stability of the U.S. As pointed out by Jeff Gundlach, manager of Doubleline Total Return Bond Fund,recently reiterated the same call stating:
“The liquidation cycle appears to have run its course with emerging market bonds, U.S. junk bonds, muni’s and MBS—all of which substantially underperformed Treasuries during the rate rise—now recovering sharply,”
With the reality that the economy has likely peaked for this current economic cycle, deflationary pressures rising and the potential for less monetary interventions in the quarters ahead the catalysts for higher bond prices are tilted in investors favor currently. As I stated previously:
“Investors are panic selling what is likely an intermediate term bottom in bond prices and holding onto to equities in what is clearly one of the most overbought, valued and extended markets since 2000 or 2007. While the mainstream market analysis continues to tout ‘buy and hold’ strategies – statistical evidence clearly weighs in favor of a rather significant correction at some point in the not so distant future. While timing of such an event is difficult at best, given the extreme amounts of artificial intervention by Central Banks globally, the impact to investors portfolios devastate retirement plans.”
For all of these reasons I am bullish on the bond market through the end of this year. Furthermore, with market volatility rising, economic weakness creeping in and plenty of catalysts to send stocks lower – bonds will continue to hedge long only portfolios against meaningful market declines while providing an income stream.
Will the “bond bull” market eventually come to an end? Yes, it will, eventually. However, the catalysts needed to create the type of economic growth required to drive interest rates substantially higher, as we saw previous to the 1980′s, are simply not available currently. This will likely be the case for many years to come as the Fed, and the administration, come to the inevitable conclusion that we are now in a “liquidity trap” along with the bulk of developed countries.
While there is certainly not a tremendous amount of downside left for interest rates to fall in the current environment – there is also not a tremendous amount of room for them to rise until they begin to negatively impact consumption, housing and investment. It is likely that we will remain trapped within the current trading range for quite a while longer as the economy continues to “muddle” along.


No comments:
Post a Comment