by Greg Harmon
From June 4. 2012 until May 22, 2013, the S&P 500 moved higher in an extended AB = CD pattern. The final leg extended to 161.8% of the initial leg. This final leg was also done in 4 steps, each 127% longer than the previous. All Fibonacci. The Fibonacci traders have been big winners. But what happens next? Last week looked like the orderly pullback you would expect, touching a 61.8% retrace of the last move. Settling back over the rising 50 day Simple Moving Average (SMA) all looked well to end the week. But then the pesky 20 day SMA got in the way and knocked it back lower. Does this mean it
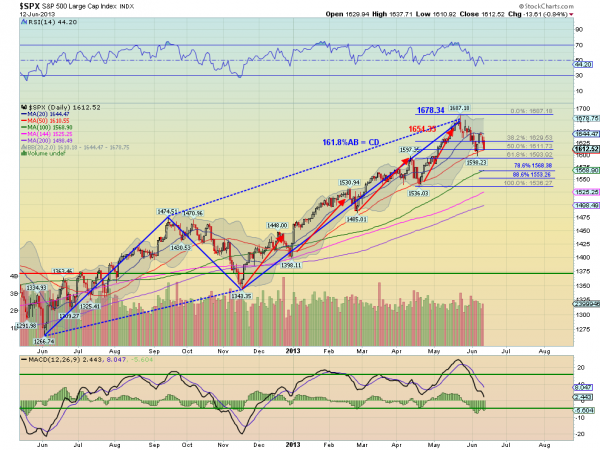
wants to head lower? Maybe. Back testing the 50 day SMA again on Wednesday as that approaches the 50% retracement sets up for an important area. Continuing with the Fibonacci’s, a break below would look at the 61.8% Fibonacci at 1593 with 1586 and 1553 beyond that before a full retrace to 1536. There are several signs that the upward trend remains though. The Relative Strength Index (RSI) is holding in bullish territory over 40, although heading lower. The SMA are all rising and most are below the price action. One day at a time will tell whether the market wants to continue higher or correct.
No comments:
Post a Comment