By: EWI
Gold and silver have been all over the financial news.
On Thursday, June 20, silver fell below $20 (-60% from 2011 high), and gold fell below $1300 (-30% from 2011 high).
We first published the chart below after metals plunged in mid-April. It shows EWI's forecasts not only leading up to those big moves ... but during the past three years of opportunity.
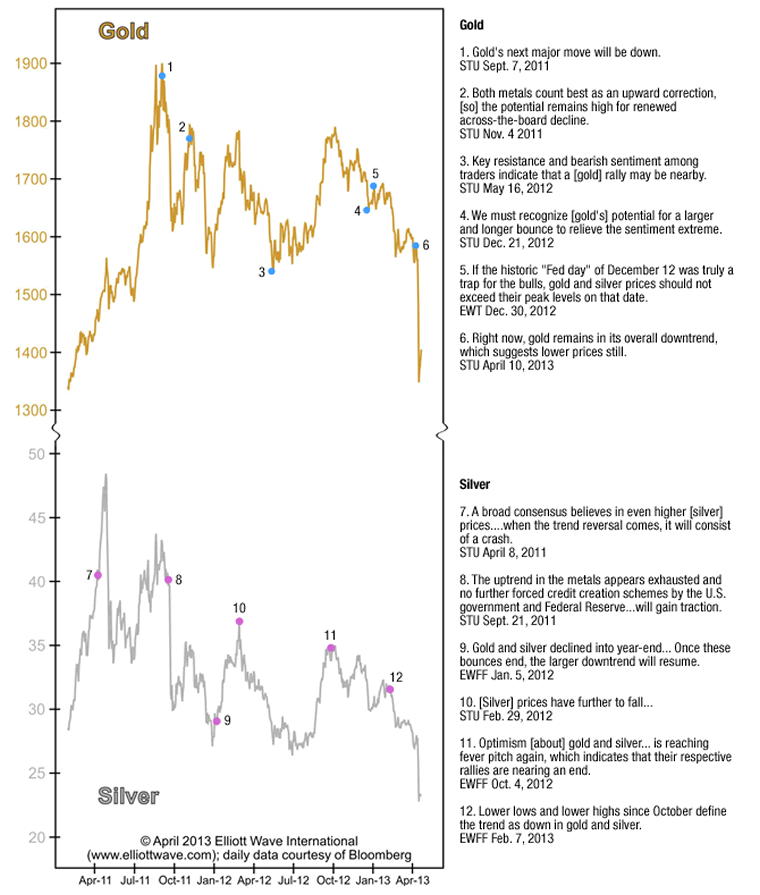
Three years of volatile price action in these two markets is plain to see. And the forecasts speak for themselves.
Overwhelmingly, most metals experts favored the other side of the gold and silver trend for the past three years - and they still do today. Meanwhile, EWI subscribers were prepared ahead of time for nearly every important turn.
Now, some periods are more vexing than others. But currently we are in a period where the wave patterns are particularly clear.
Metals prices may bounce higher near-term - like we warned they would do after the April 16-18 lows - but the quotes on the chart clearly show how countertrends are the source of opportunity. And that is the great strength of pattern analysis via the Elliott wave method, along with tools like sentiment, momentum and price.
No comments:
Post a Comment