by Greg Harmon
Last week’s review of the macro market indicators looked for Gold ($GLD) and US Treasuries ($TLT) to continue their moves higher in the coming week, with Crude Oil ($USO) and the US Dollar Index ($UUP) continuing lower. The Shanghai Composite ($SSEC) looked to consolidate further in the middle of its range while Emerging Markets ($EEM) did the same at the upper end of their range. Volatility ($VIX) looked biased to the upside contributing to the view that Equity Indexes, $SPY, $IWM and $QQQ will continue lower. All looked to remain within their ranges of the last 6 months with the QQQ remaining the strongest much higher in its range. News driven breaks to the upside should be contained in that range with the possible exception of the QQQ’s.
The week played out a lot like anticipated with Gold and Treasuries rising. Crude Oil fell out of bed but the US Dollar consolidated before moving higher late in the week. The Shanghai Composite did consolidate further but Emerging Markets took their cue from global markets and sold hard. Volatility moved higher as Equity Indexes fell throughout the week, ending with the SPY, IWM and QQQ all breaking their 6 month ranges lower. What does this mean for the coming week. Let’s look at some charts.
As always you can see details of individual charts and more on my StockTwits feed and on chartly.)

VIX Weekly, $VIX

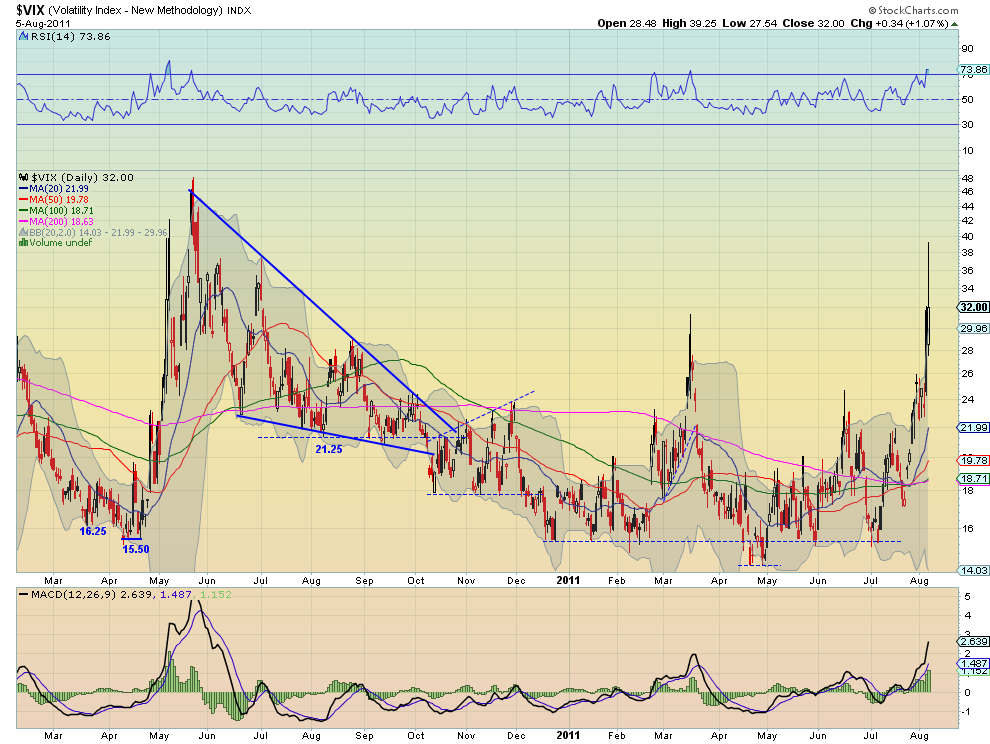
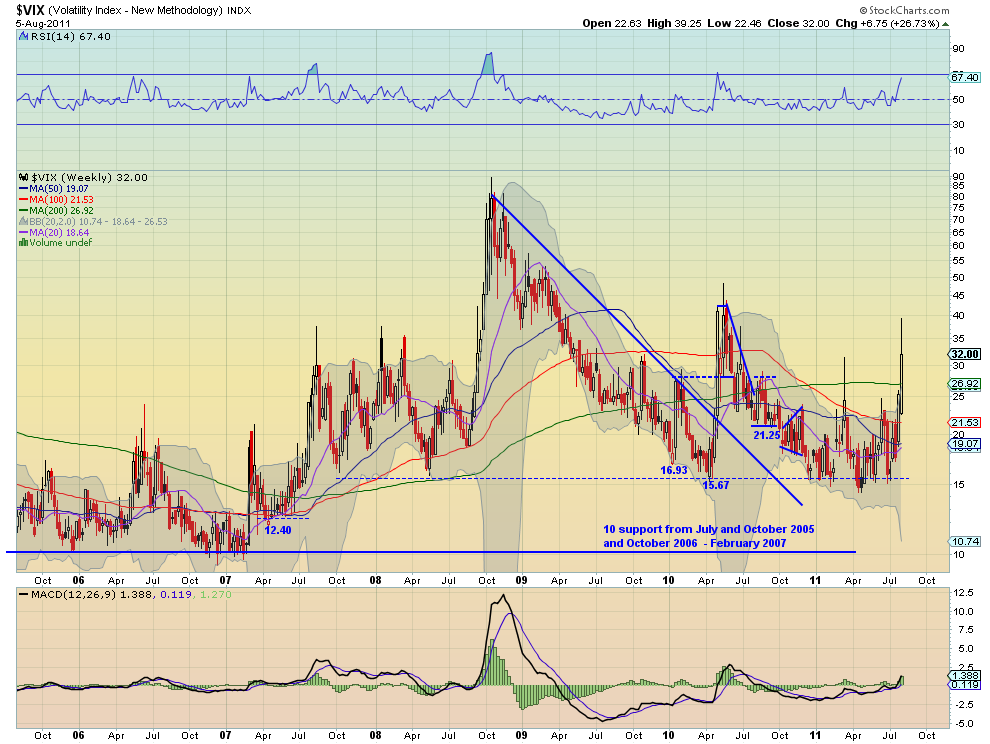
After weeks of creeping slowly higher in a stable range, the Volatility Index broke higher this week, spiking near 40 on Friday. The RSI and MACD on the daily timeframe continue to support rising volatility going forward, although the RSI has historically pulled back at these levels. The weekly chart shows the break is currently lower than the last break up from April 2010, continuing the lower highs and creating a descending triangle. The RSI from the weekly chart is not over 790 yet but notice the reaction to that level the last two times it got there. Look for any further spike in Volatility to be contained at the previous weekly high at 48 and the long shadows suggesting a pullback in the coming week.

SPY Weekly, $SPY

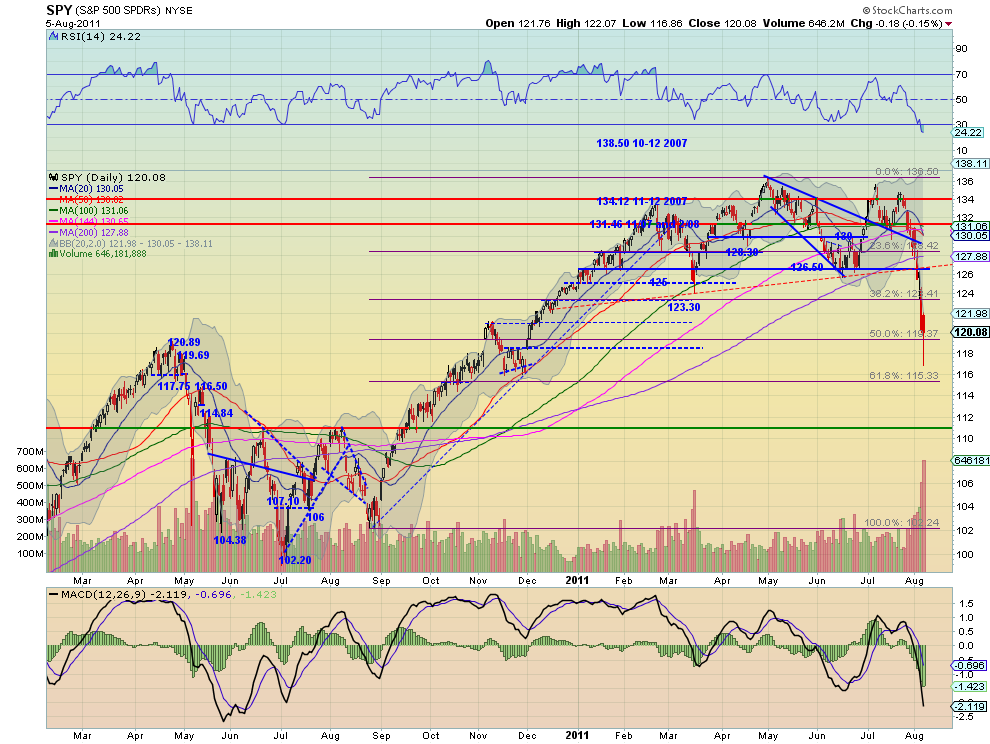
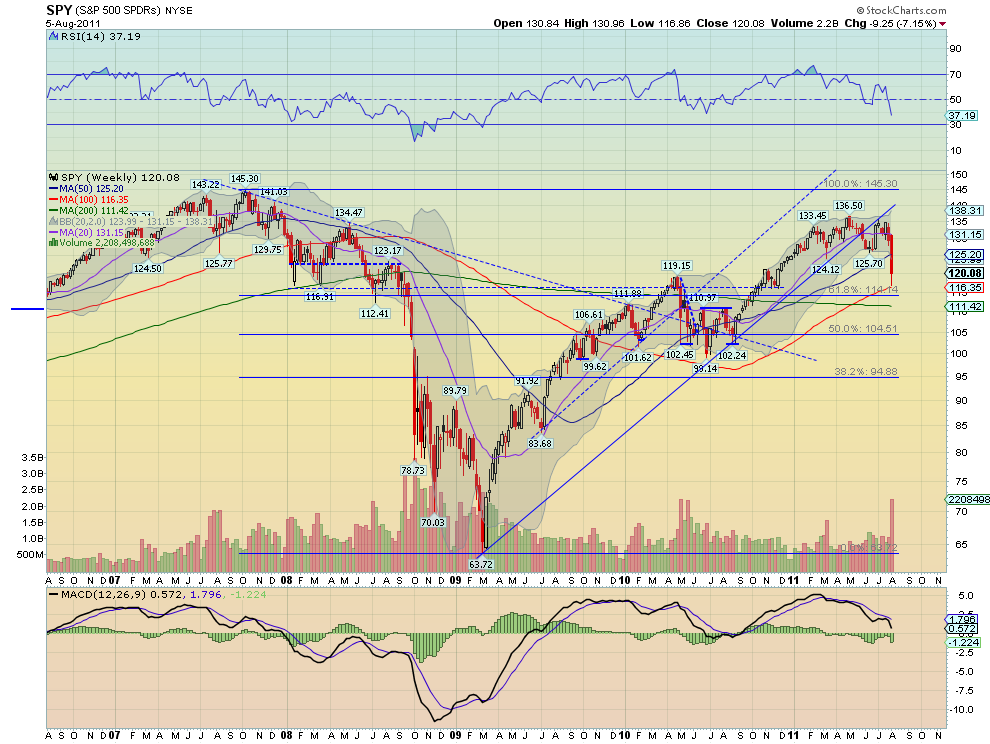
The SPY took the elevator down as they say, dropping over 10% at its worst. The daily chart shows the move lower accelerating after it broke the neckline of the Head and Shoulders top where it intersected the bottom of the six month consolidation channel. The RSI on the daily chart is now under 25, getting oversold, and the MACD is very high. There was a large volume run up on the move lower and it is now out of the Bollinger bands for 3 days. Finally all of the SMA’s are sloping lower. The weekly chart shows a touch near the 100 week SMA with a RSI that is pointing lower and the MACD starting to grow more negative. The SPY looks to head lower but with the quick and steep decline out of the Bollinger bands there is a good chance of consolidation or a bit of a reversion higher before it continues down. Look for 124 or 126 to contain any up move and an eventual target of 114-116 at least, and below that 111.
Next week will be interesting on many levels. Gold appears ready to consolidate, if only for a couple days within the uptrend while Oil may consolidate before continuing the fall. The US Dollar Index ETF looks to drift higher in the 20.88 to 21.90 range while US Treasuries pullback. The Shanghai Composite appears headed lower toward support and Emerging Markets may consolidate or bounce a bit before doing the same. The spike in Volatility looks to have more room to the upside but shows signs of pulling back at least early in the week. The Equity Index ETF’s SPY, IWM and QQQ appear set to bounce early next week, but the SPY and IWM charts look broken on many timeframes and headed lower. The QQQ is a bit of an enigma as it has maintained a hold at support. The QQQ’s continuing to hold and move higher would be a signal that the broad downturn may be ending. On the other hand if the SPY and IWM continue lower as expected in the intermediate term the QQQ will likely join them lower. Use this information to understand the major trend and how it may be influenced as you prepare for the coming week ahead. Trade’m well.
No comments:
Post a Comment