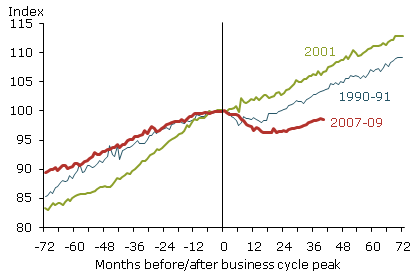
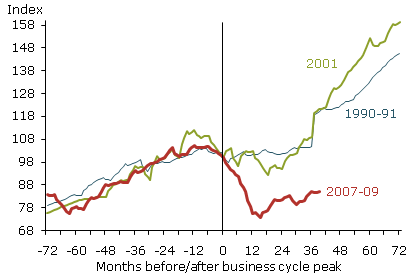
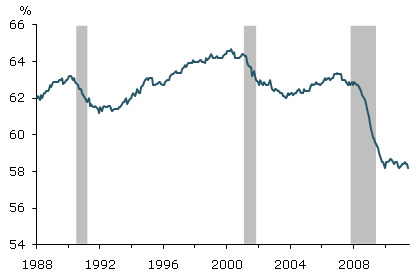
Green shoots have turned out to be yellow weeds. The SF Fed has an excellent new piece of research summarizing just how extraordinarily odd this recession has been. In a rather succinct piece, they show just how below trend the “recovery” has been and just how damaging it has been to the US household:
“In the mid-2000s, an enormous speculative housing bubble emerged in the United States. An accommodative interest rate environment, lax lending standards, ineffective mortgage regulation, and unchecked growth of loan securitization all fueled an overexpansion of consumer borrowing. An influx of new and often unsophisticated homebuyers with access to easy credit helped bid up house prices to unprecedented levels relative to rents or disposable income. Equity extracted from rapidly appreciating home values provided households with hundreds of billions of dollars per year in spendable cash, significantly boosting consumer spending. The consumption binge was accompanied by a rapid increase in household debt relative to income and a decline in the personal saving rate (see Lansing 2005).
The persistent rise in home values encouraged lenders to ease credit even further on the assumption that house price appreciation would continue. But when these optimistic projections failed to materialize, the bubble began to deflate, setting off a chain of events that led to a financial and economic crisis. The “Great Recession,” which started in December 2007 and ended in June 2009, was the most severe economic contraction since 1947 as measured by the peak-to-trough decline in real GDP.
The Great Recession triggered a dramatic shift in household spending behavior. Real personal consumption expenditures trended down for six quarters, the personal saving rate more than tripled from around 2% to over 6%, and households began a sustained deleveraging process that is still under way (see Glick and Lansing 2009).
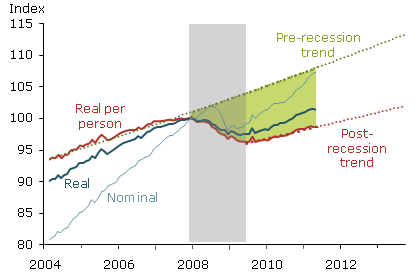
This Economic Letter estimates the amount of consumption lost from the Great Recession by comparing the actual trajectory of real personal consumption expenditures to its pre-recession trend. The amount turns out to be quite large. From December 2007 through May 2011, foregone consumption per person was over $7,300, or about $175 per person per month.”(Real personal consumption expenditures per person)(Real household net worth per person)(Personal consumption expenditures)


No comments:
Post a Comment