Saturday, April 5, 2014

The Stock Market’s Annual Seasonality is a Real Concern This Year

By: Sy_Harding

As we move into April, it’s important to look at the stock market’s long history of making most of its gains each year in a favorable ‘season’ of November to April, while most of its corrections and bear market down-legs take place in an unfavorable season from May to October.

Many academic studies and investment strategies going back to the 1970’s have confirmed the pattern, long referred to as ‘Sell in May and Go Away’.

In recent times, an academic study published in the American Economic Review in 2002 concluded that, “Surprisingly, we found this inherited wisdom of Sell in May to be true in 36 of 37 developed and emerging markets. Evidence shows that in the United Kingdom the seasonal effect has been noticeable since the year 1694. . . . . . The additional risk-adjusted outperformance [over buy and hold] ranges between 1.5% and 8.9% annually, depending on the country being considered. The effect is robust over time, economically significant, unlikely to be caused by data-mining, and not related to taking excessive risk.”

A 2012 study of the 40-year period from 1970-2011, published by the Social Science Research Network, concluded that, “Surprising to us, the old adage “Sell in May and Go Away” remains good advice. . . . . On average, returns are 10 percentage points higher in November to April semesters than in May to October semesters.”

In spite of decades of such studies and overwhelming evidence, the financial media still refers to market seasonality not as fact, but as a ‘theory’. They point out that it’s an “iffy thing”, since some years it doesn’t work out, and investors can be “hurt” by being out of the market in the summer months.

It is true that seasonal investing does not outperform the market every individual year. However, that is a nonsensical argument against it. There is no strategy that outperforms every single year. That applies most emphatically to ‘buy and hold’.

Secondly, seasonal investors do not get ‘hurt’ by being out of the market in those individual years when the market continues to rally in its unfavorable seasons. They do not have losses by doing so. They merely take their profits from the winter rally and miss out on some additional gains while safely on the sidelines.

Additionally, the historical evidence that clearly shows seasonal investing substantially outperforms the market over the long term (while taking only 50% of market risk) includes those individual years when it did not outperform

However, an investor who holds through the unfavorable seasons does have losses, sometimes large losses, and is significantly hurt in those years when seasonal timing does work. And the statistics show it does work in most years.

The willingness to ignore seasonality is particularly staunch this year. Investors are unusually bullish and confident, and there has not been a significant correction in the summer months for two straight years (when the Fed pumped in massive amounts of QE stimulus to prop up the economy, much of which instead flowed into paper assets like stocks).

Yet, for those paying attention, even against that massive Fed influence in those years, the effect of seasonality was still clear.

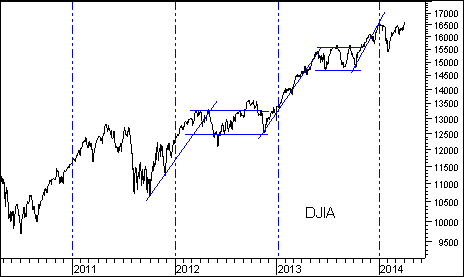
Though there was no correction in 2013, the market still made most of its gains for the year in the traditional favorable seasons, and moved basically sideways in the unfavorable summer season. That was also true of 2012.

The big question for this year is whether it will be three straight years that seasonality does not ‘work’. Or will it more likely resemble 2011 (or worse), when massive QE stimulus did not prevent a 20% market plunge in the unfavorable season. (The only thing that prevented it from becoming worse in 2011 was that the Bernanke Fed rushed in to double the QE from $40 billion a month to $85 billion a month).

This year the Fed is tapering back stimulus, and will have it back down to $35 billion in May.

There are additional reasons to expect seasonality will be especially important this year. The market is significantly overvalued by historic standards. It is the usually negative second year of the Four-Year Presidential Cycle (in which since 1934 the average decline has been 21%). Meanwhile, the current bull market is now 61 months old. Not many have lasted as long.

While the traditional ‘Sell in May’ strategy calls for exiting May 1, in my work I prefer to use a technical momentum-reversal indicator in addition to the calendar. Doing so sometimes delays the exit signal into June, while other years it triggers the exit signal in April.

This year in particular, investors constantly pounded with advice to buy this or that promising stock or etf, might want to step back for a few minutes to look at the big picture of seasonality. Being ready to take downside positions in ‘inverse’ etf’s or short-sales when the time comes may be preferable.

See the original article >>

The Week Ahead: The Stock Market Is NOT Rigged for Investors

by Tom Aspray

The action in the global markets last week was lost in the uproar over the high frequency trading (HFT) controversy that resulted from the new book by Michael Lewis. Though many of his past books have been good reads, I think his biggest triumph may be the marketing of his latest book.

Last week, you could have almost seen Mr. Lewis 24/7 as the bullet point was that the  “stock market is rigged.” This likely caused many regular investors to either call their advisors or to alter their plans to invest in the stock market.

In Monday’s column, I expressed my view that this was probably bullish for the stock market, as it would keep bearish sentiment high, as many individual investors would wait to invest. However, I think the focus on rigged markets does a disservice to investors.

As the  NY Times pointed out ” But as an investor, high-frequency trading doesn’t matter because you’re focused on the boring work of buying good things and owning them for a long time.” In discussions with veteran traders a year ago, few were concerned about HFT as they had seen little impact on their results.

chart
Click to Enlarge

This long-term chart of the S&P 500 compares the price index with the total return that reflects the reinvestment of dividends. Though the bear market pullbacks in 2000 and 2008 were severe, the argument for long-term appreciation in the stock market is strong.

This chart is from last August’s article from David Blitzer of S&P Dow Jones Indices, who pointed out that “One thousand dollars invested in the S&P 500 at the end of January, 1998 would have been worth $5557 at the end of July, 2013. However, if the dividends were reinvested in the index, the investment would be worth $10,635 by the end of July.”

One last comment on what it really means for investors is the generally ignored quote from Mr. Lewis that  “It doesn’t follow from the story in the book that you should flee the market.” Too bad there wasn’t more focus on this comment as the dividend’s reinvested chart makes a powerful argument for investing in stocks.

chart
Click to Enlarge

As the first quarter has ended, the performance of many asset classes has seen some significant changes in just the past two weeks. In the middle of March (see chart), the Vanguard Emerging Markets Index (VWO) has gone from down 1.9% to up over 3% as the performance now matches that of the Spyder Trust (SPY).

In fact, for the year, these two markets and the previously recommended Vanguard European Stock Index (VGK) are all now about even as they are up just over 3%. The SPDR Gold Trust (GLD) has given up more of its gains as it is now up just over 5%. (Editor’s Note: This chart does not include Friday’s trading.)

Based on the quarterly pivot point analysis, as discussed in last week’s Follow the Trend with Quarterly Pivots this may have been an important week for both GLD and the Market Vectors Gold Miners (GDX).  Both started the second quarter below their new pivots, but rallied last week to close back above their pivots, suggesting that the worst of their decline may be over.

The bond market, as represented by the iShares 20+ Year Treasury Bond ETF (TLT) is still up just over 5% as the yield on the 10-Year T-Note is still locked in it’s trading range. The generally bullish job report last Friday should allow the Fed to stay on its tapering course for the near future.

From a technical standpoint, I continue to expect yields to eventually breakout to the upside at some point this year. As I stated a few weeks ago, a strong weekly close in the 10-Year T-Note yield above 3.02% would be an upside breakout and signal a move to the 3.4-3.5% area.

This could be a real problem for those in a high yield mutual fund or ETF bond fund. As the chart indicates, $3.42 billion moved into these instruments in the first quarter. I am afraid that many of the buyers do not fully understand the risk of capital loss in these instruments that could result if yields move significantly higher.

chart
Click to Enlarge

The ECB decided last week to keep their rate at the same level, despite the low inflation rate and the threat of deflation. One surprising fact was that the yield on the 5-year Spanish bonds dropped below that of the US 5-Year T-Note yield.  Few would have guessed that this was possible a year ago, as it has not occurred since 2007.

chart
Click to Enlarge

In another important moment for the bond market, Pimco’s Bill Gross noted the passing of his fourteen-year old female Maine coon cat named Bob. He can be seen in the picture above watching Bill on TV. It is nice to see that someone who has over $2 trillion assets under management has a heart, as well as a sense of humor.

The economic data was generally positive last week, though the manufacturing data was mixed. The Dallas Fed Survey reflected strong growth while the Chicago PMI did not.  Factory orders were better than expected.

The all-important ISM Manufacturing Index improved from February to 53.7, but was a bit below expectations. The chart shows a slight uptrend but needs to move above the downtrend, line a, to signal strong manufacturing. Of course, a drop below 50 would imply contraction and the chart has important support at line b. The PMI Services Index bounced back nicely after a weak reading in February.

chart
Click to Enlarge

There is a very light economic calendar this week, with the FOMC minutes on Wednesday with Export Prices and jobless claims on Thursday. On Friday, we get the Producer Price Index as well as the preliminary reading from the University of Michigan on Consumer Sentiment.

The technical outlook for the stock market has improved since the last Week Ahead column, despite the wild action on Friday. The S&P futures rallied about six points in early reaction to the jobs report, but in the fist fifteen minutes of the regular session, it had given up all of those gains.

The selling has been the heaviest again in the Nasdaq and Russell 2000, as the large-cap Dow Industrials have held up better, so far. By early afternoon, the Dow was down 0.47%, while the Nasdaq Composite was down 2.25%.

As I discuss in more detail below, the outlook for the overall market, based on the NYSE Composite, is positive from both a weekly and daily perspective. This suggests that this is a pullback within an uptrend, not the start of a major correction.

On the other hand, the daily outlook for the biotech-heavy Nasdaq 100 and Powershares QQQ Trust (QQQ) is negative, while the weekly analysis is still positive. The relative performance analysis warned several weeks ago that the QQQ was no longer a market leader and the recent action has confirmed it.

The majority of sector ETFs are still going to close the week above their new quarterly pivots (see table) as these pivots did provide a pretty good guide in the first quarter.

The bond market rallied last week, but that has not changed my argument in favor of stocks over bonds. Therefore, I continue to favor shortening the maturity of your bond portfolio and would have strict risk controls in place for holders of high yield funds or ETFs.

chart
Click to Enlarge

The five-day MA of the percentage of S&P 500 stocks above their 50-day MAs has risen sharply over the past two weeks from the 64% area to 76.6%, as of Thursday’s close. This is a new high and suggests that the break of the downtrend from last May, line a, was legitimate.

According to AAII, the individual investors turned a bit more bullish last week as the % bullish rose from 31.2% to 35.4%. Still, only 26.7% are bearish, which is still too low as it was 36.4% on February 6.

The daily chart of the NYSE Composite shows that it is still well above the 20-day EMA at 10,456. The daily starc- band is at 10,366, which is quite close to the monthly projected pivot support. There is chart support at 10,300, line b, with the quarterly pivot at 10,220.

chart
Click to Enlarge

The daily NYSE Advance/Decline made another new high last week as it had overcome the resistance at line c last month. The weekly A/D line (not shown) made another new high at the end of March and continues to act stronger than prices. Both are holding well above their rising WMAs.

The McClellan oscillator broke its downtrend (line d) last Monday, indicating that the correction was over. It dropped back below the zero line on Friday and could retest the former downtrend before the correction is over.

chart
Click to Enlarge

S&P 500
The daily chart of the Spyder Trust (SPY) shows Friday’s sharp drop as it closed just above the 20-day EMA at $186.48. The daily starc- band is now at $183.59 with quarterly pivot at $183.25, line a.

There is initial resistance now in the $188-$188.60 area and then at last Friday’s early high of $189.70. The daily starc+ band has now risen to $191.20 with the weekly at $193.88.

The daily OBV broke out to the upside in late February and made convincing new highs in March. Since then, it has formed lower highs as it has diverged from prices and is back below its WMA. The weekly OBV (not shown) gives a much different picture as it made a new high two weeks ago and is rising with last week’s higher close.

The daily S&P 500 A/D line made significant new highs last week as it is well above the support at line d.

Dow Industrials
The SPDR Dow Industrials (DIA) also managed to close the week higher, but well off the best levels, as it hit a high of $166.06 which was well above the prior high. The daily chart shows the breakout above the resistance at line e, and then the close on Friday back below the breakout level.

The rising 20-day EMA at $163.40 should provide first support with further in the $162 area. There is more important support in the $160.52 area with the quarterly pivot at $160.88.

The daily  on-balance volume (OBV) continues to look weak as it has formed lower highs, line g, and is back below its WMA. In contrast, the weekly OBV is still above its WMA and is close to making new highs.

The daily Dow Industrials A/D line did confirm the upside breakout as it was able to move through the resistance at line h. It is also above its rising WMA and should not drop below the late March lows.

chart
Click to Enlarge

Nasdaq-100
The daily chart of the PowerShares QQQ Trust (QQQ) shows the sharp drop on Friday as it closed below the quarterly pivot, line a, at $87.47. As noted at the time, a weekly low close doji sell signal was triggered on March 14.

The March low is at $86.40 with the monthly projected pivot support at $85.66. There is even stronger support at the February low of $83.20, line b. The daily starc- band is now at $85.10 with the weekly.

There is next support at $88.45 and the monthly pivot. The 20-week EMA is at $86.17 and the trend line support is at $85.50. The weekly starc- band is a bit lower at $84.11.

The weekly relative performance (not shown) will close sharply lower this week and is so far below its WMA that it is oversold.

The daily OBV has continued to form lower highs, line b, since it peaked in January. It has also formed lower lows, line c,  but is now getting closer to support from the October 2013 lows. In contrast, the weekly OBV (not shown) is still above both its trend line support and its rising WMA.

The Nasdaq 100 A/D line was strong last week, but failed to make a new high (see arrow) even though it came close. If it drops below the most recent low it is likely to test the breakout level.

The QQQ now needs a close above last week’s high at $89.68 to stabilize.

Russell 2000
The iShares Russell 2000 Index (IWM) shows a similar plunge as the QQQ, as it closed below the quarterly pivot, line e, at $114.70. It did close the week lower with next support at $113.69 which was the prior week’s low. The daily starc- band is at $112.32 with the weekly at $110.31.

The weekly relative performance, after breaking out to new highs in early March, has reversed and fallen below last fall’s lows.

The daily OBV failed to reach its declining WMA last week and is now getting close to long-term support at line f. The weekly OBV (not shown) is ready to close below its WMA, so the multiple time frame OBV analysis is now negative. The weekly is still above trend line support.

The Russell 2000 A/D line failed to move above the resistance, at line g, last week and has closed below its WMA.

There is first resistance now for IWM at $116.81 and the 20-day EMA, with further at last week’s high of $118.48.

See the original article >>

weekend update

by Elliott Wave Theory

REVIEW

Interesting finish to quite a positive week. The week started off by gapping up Monday/Tuesday and hitting a record high. Wednesday/Thursday also produced record highs, and the DOW made an all time high too. The NDX/NAZ, however, came under selling pressure at the open on Thursday, and remained under selling pressure into Friday’s close. The SPX/DOW gapped up to new highs early Friday, but then gave way ending the week with moderate gains. For the week the SPX/DOW were +0.5%, the NDX/NAZ were -0.8%, and the DJ World index rose 1.0%. Economic reports for the week were again mainly to the upside. On the uptick: ISM manufacturing/services, construction spending, auto sales, the ADP, factory orders, Payrolls, the WLEI and Investor sentiment rose. On the downtick: Chicago PMI and the monetary base, plus weekly jobless claims and the trade deficit rose. Next week we get the FOMC minutes, Export/Import prices and the PPI.

LONG TERM: bull market

The US bull market is currently five years old. Historically, since 1885, there have only been four other bull markets of this duration or longer: 1921-1929, 1932-1937, 1987-2000 and 2002-2007. When we reviewed the previous two 5 year bull markets we observed they were quite similar in wave structure: waves 1 thru 4 took two years, and wave 5 took three years. This bull market does not look like either of them. Actually its wave structure currently looks more like the 1921-1929 bull market: wave 1 two years and wave 3 three years. However, since this bull market has had a tendency to truncate fifth waves, the structure alone is not considered enough evidence to anticipate a potential 8 year bull market. So we dug a bit deeper.

SPXweekly

What we uncovered was quite interesting. Each of the previous four lengthy bull markets were quite oversold during their fourth wave, except for 2002-2007. In each of the other three bull markets their fifth waves then lasted for another two-three years. Currently our bull market is still in the process of completing its third wave: Primary III. When the fourth wave does arrive we will likely be able to determine if the fifth wave, Primary V, will end this year or extend into 2017. The key, of course, is the wave structure, and the extent of the Primary IV selloff. If during Primary IV the market loses substantially less than 20% of its value, Primary V will likely be short lived. If during Primary IV the market loses 20% or more of it value, Primary V is likely to extend for another three years. Then we would have an eight year Cycle [1] bull market instead of five years. As a result we have upped our Q3 – Q4 target of SPX 1970, to SPX 1970 – 2070. It is still too early to tell if it will end the bull market, or just end Primary III. Stay tuned.

MEDIUM TERM: uptrend

Last weekend we noted the market had hit an interesting juncture and offered the following. Currently we see three potential scenarios, in order of preference, short term. One: the NDX/NAZ confirm a downtrend next week, bottom within a few days, then all four major indices are aligned for the next wave up. Two: the NDX/NAZ is currently bottoming, with no downtrend confirmation, and all four major indices remain out of sync for the next wave up. Three: the situation in Ukraine/Russia worsens resulting in a panic selloff in equity markets, and all four major indices realign at the early February lows.

SPXdaily

The market opened the week like it was taking on scenario number two. The NDX/NAZ began to rally and the SPX/DOW rallied to all time new highs. At the open Thursday, however, the NDX/NAZ started to selloff again and by Friday’s close had reverted to scenario number one. Interesting week! Currently we have the NDX/NAZ in confirmed downtrends, and the SPX/DOW still in uptrends. This suggests, despite Friday’s sharp decline, the four major indices are trying to realign for the rest of Primary III.

NAZdaily

Currently we have the NDX/NAZ in Intermediate wave four downtrends. When this downtrend completes these indices will still need two more uptrends to end Primary wave III: Major wave 3 and Major wave 5. The SPX/DOW are more advanced as they are already in Major wave 5. But their Major 5 is subdividing into five Intermediate waves. Currently they are in Intermediate wave iii, and require another uptrend after this one to complete Primary III. Should the NDX/NAZ reverse next week and enter an uptrend without the SPX/DOW entering a downtrend they will realign. Then the four major indices can complete their trends in unison to end Primary III. Yes, it is a bit confusing since these indices are unfolding in different wave patterns. But the potential alignment is now setup. All we need is for the NDX/NAZ to reverse and start uptrending early next week. Medium term support is at the 1841 ad 1828 pivots, with resistance at the 1869 and 1901 pivots.

SHORT TERM

Short term support is at the 1841 and 1828 pivots, with resistance at the 1869 and 1901 pivots. Short term momentum ended the week extremely oversold. The short term OEW charts are negative with the reversal level now SPX 1879.

SPXhourly

We have been counting this uptrend, since early February at SPX 1738, as Intermediate wave iii. Thus far it has completed Minor waves 1 and 2 at SPX 1884 and 1842 respectively. The recent rally to all time highs at SPX 1897 should be Minute one of Minor wave 3. And Friday’s decline to SPX 1863 should be all, or most, of Minute wave ii.

We counted five waves up from SPX 1842 to 1897: 1867-1853-1894-1883-1897. Since the fifth wave was the shortest in the structure, and it ended in a diagonal triangle on the one minute chart. It was not too surprising to see Fridays pullback go below the start of the first wave (1867). Pullbacks are usually fairly steep when fifth waves are short. On Friday the SPX dropped from the OEW 1901 pivot range (1894-1908) to the OEW 1869 pivot range (1862-1876) which is currently creating support.

With the short term momentum extremely oversold the market should experience at least a bounce quite soon. The down trending NDX/NAZ are also displaying a positive RSI/MACD divergence at Friday’s low on their hourly and daily charts. In the past this has usually led to an uptrend. While Friday’s selloff looked quite nasty, it may be quite positive longer term. However, should the SPX continue to decline and break below the OEW 1841 pivot range (1834-1848) it will likely be in a downtrend as well. Next week we will be watching the NDX/NAZ for signs of a reversal, plus the 1869 and 1841 pivots.

FOREIGN MARKETS

The Asian markets were mostly higher on the week for a net gain of 1.3%.

The European markets were also mostly higher on the week for a net gain of 1.6%.

The Commodity equity group were all higher on the week for a net gain of 2.5%.

The DJ World index is still uptrending and gained 1.0% on the week.

COMMODITIES

Bonds remain in a downtrend and lost 0.2% on the week.

Crude remains in an uptrend but lost 0.6% on the week.

Gold is also in a downtrend but gained 0.6% on the week.

The USD is uptrending again and gained 0.2% on the week.

NEXT WEEK

Monday: Consumer credit at 3pm. Wednesday: Wholesale inventories and the FOMC minutes. Thursday: weekly Jobless claims, Export/Import prices, and the Budget deficit. Friday: the PPI and Consumer sentiment. As for the FED. Tuesday: Congressional testimony from General counsel Alvarez, and a FED board meeting right after the close. Wednesday: a speech from FED governor Tarullo in the evening. Sunday afternoon: a speech from FED governor Stein. Busy week for the FED and likely for the markets too. Enjoy your weekend and week!

See the original article >>

Kane–Silenced by the night

"Silenced By The Night"
In a city like mine, there's no point in fighting
I close my eyes, see you and me driving
If I am a river, you are the ocean
Got the radio on, got the wheels in motion
[Chorus]
We were silenced by the night
But you and I, we're gonna rise again
Divided from the light
I wanna love the way we used to then
I lie in the dark, I feel I'm falling
Feel your hand on my back, hear your voice calling
I'm out of my depth girl, stick close to me
Because the people in this town, they look straight through me
[Chorus]
We were silenced by the night
But you and I, we're gonna rise again
Divided from the light
I wanna love the way we used to then
Cause baby I'm not scared of this world when you're here
And baby I'm not scared of this world when you're here
Oh oh oh
You and I we're gonna rise again
Oh oh oh
You and I, we're gonna rise again
We were silenced by the night
But you and I, we're gonna rise again
Divided from the light
I wanna love the way we used to then

Friday, April 4, 2014

Black and White

1797441_10201447785698356_727318696_n

Time to Ditch Stock Market Swinging Cyclicals?

By: InvestmentContrarian

George Leong writes: The stock market appears to be getting somewhat top-heavy. Scanning through my screens, I am quite amazed to find that the majority of S&P 500 stocks are well above their respective 200-day moving averages, which makes opportunities much more difficult to come by for the average investor who might look at their portfolio once a week or month.
But the buying in the stock market has still largely been with the technology, growth, and small-cap stocks, due to the higher potential to make quick money versus investing in blue chips or industrial companies.

In 2013, we saw staggering upside moves in some of the momentum stocks, such as Google Inc. (NASDAQ/GOOG), priceline.com Incorporated (NASDAQ/PCLN), Netflix, Inc. (NASDAQ/NFLX), and Chipotle Mexican Grill, Inc. (NYSE/CMG). These are the top players in their respective areas.

But that was then. Now, we are seeing a renewed interest in some of the safer names in the stock market, which is why the Dow Jones and S&P 500 outperformed in March.

My view is that while there will still be money to be made in some of the more speculative and momentum plays in the stock market, we could also see a pause for investors to digest the gains made.

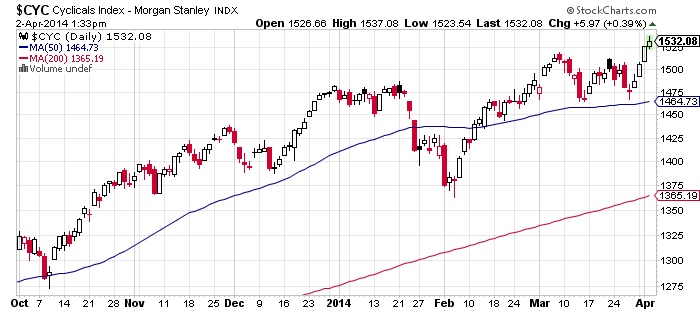
Cyclical stocks, or those companies that swing with the economy, are still worth a look, but should the economic renewal stall and jobs creation dry up, it might be time to look elsewhere. Here I’m talking about those sectors such as auto, furniture, retail, travel, and restaurants.

Everyone is spending when all is good and people are making money on the stock market, but spending will curtail on any signs of slowing and a drop in confidence.

The Morgan Stanley Cyclicals Index shows the uptrend in the cyclical stocks.


Chart courtesy of www.StockCharts.com

The area that will perform best in an economic downturn is the defensive sector—the area that comprises boring companies that make products that are used every day.

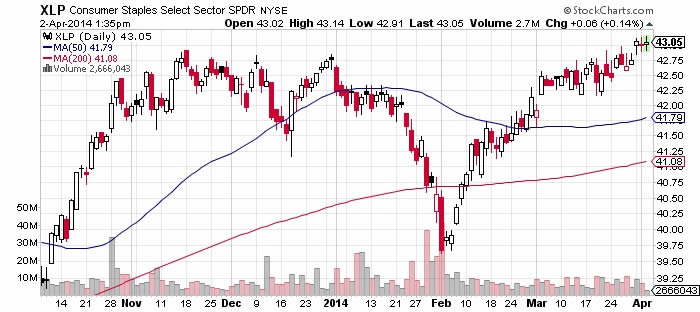
When the economy is growing, these stocks manage to produce average returns, though they underperform cyclicals. However, in a downtrending economy, defensive stocks tend to outperform.

The chart of the Consumer Staples Select Sector below shows the rally in defensive stocks since February.


Chart courtesy of www.StockCharts.com

Defensive sectors in the stock market include utilities and consumer staples. Some of the top proven defensive stocks include the likes of Kimberly-Clark Corporation (NYSE/KMB), The Travelers Companies, Inc. (NYSE/TRV), CVS Caremark Corporation (NYSE/CVS), and The Clorox Company (NYSE/CLX). Boring stocks, but they will deliver excellent long-term returns.

So the idea now is to monitor the stock market and look for clues on where the money is going. This year may turn out to be the year for defensive plays with excellent dividend flows and the ability to make some capital gains while seeking capital preservation.

See the original article >>

Follow Us