Mixed long/short open position
Today no new entry orders
We stopped at breakeven on V
7 Open Positions
3 Long
4 Short
4 with Stop Loss at breakeven
We are happy to offer free signal service for Super Stocks until the end of March
Please send me your email address so I can invite you on my server to do the demo. Mail me to take the offer and start the free service until the end of March michele.giardina@quantusnews.com
Material in this post does not constitute investment advice or a recommendation and do not constitute solicitation to public savings. Operate with any financial instrument is safe, even higher if working on derivatives. Be sure to operate only with capital that you can lose. Past performance of the methods described on this blog do not constitute any guarantee for future earnings. The reader should be held responsible for the risks of their investments and for making use of the information contained in the pages of this blog. Trading Weeks should not be considered in any way responsible for any financial losses suffered by the user of the information contained on this blog.
The U.S. Dollar Index is on the move since yesterday when the FED said it would reduce its monthly bond purchases by an additional $10 billion to $55 billion. The U.S. Dollar Index also recovered on hints from Fed Chair Janet Yellen that the bank could begin to raise interest rates sooner than anticipated.
Gold is moving down, the S&P 500 is falling as well, and USD is up against all other major currencies. Our focus today and tomorrow will be on EUR/USD. A decline from 1.3966 March high is in three legs, and now we need to have to wait on important evidences, either to confirm a corrective retracement which would allow us to look for longs once the market bottoms or we wait more signs for a bearish impulse as this one is also one of the possibility.
However, for a bearish case we would need to see further impulsive weakness down 1.3700/40, to make sure it’s an extended wave (iii).
The bearish count has my special attention because of the S&P 500 that can revisit 1820 level from last week. EUR/USD and S&P 500 has positive correlation now. In fact EUR/USD is even weaker than the S&P 500 so if S&P 500 will fall down, which is expected then Euro may lose even more value against the USD.
Yesterday, Janet Yellen gave her first post-FOMC meeting press conference. In her prepared statement, she stated exactly what was already expected:
1) accommodative policy will remain in place for a considerable amount of time after the current quantitative easing program ends this fall,
2) employment is improving,
3) the economy is recovering but has more work to do, and;
4) the current quantitative easing program would be "tapered" from $65 to $55 billion per month beginning in April.
The problem for the markets came during her press conference when she was asked what a "considerable amount of time" between the end of the current QE program and the first rate hike would be. She replied: "About six months." It took the markets about 5-seconds to understand exactly what that meant: "Rate hike in early 2015." If you want to know the precise moment that those words were uttered, just look at the chart below to see if you can figure it out.
The question is this:
"If the Fed begins to hike interest rates, what effect does that have on the economy and the markets?"
According to Jim Cramer last night, he said the idea of rising interest rates shocked the markets, however, in the long-term it's a positive sign. Rates rise as the economy does better.
The assumption he makes is that as the economy "catches fire" and corporate profits increase, then it is natural for interest rates to rise also. If a growing economy is a function of expanding profitability, then what is wrong with the chart below. (For more detail read: 50% Profit Growth)
"The chart below shows corporate profits, per the BEA, divided by GDP. (You can substitute GNP but the result is virtually identical between the two measures.)"
"The current levels of profits, as a share of GDP, are at record levels. This is interesting because corporate profits should be a reflection of the underlying economic strength. However, in recent years, due to financial engineering, wage and employment suppression and increase in productivity, corporate profits have become extremely deviated."
Cramer, also correctly states that much of the profitability increases for corporations have come from stock buybacks and cost cutting. However, many of those stock buybacks and dividend increases (as with AAPL) have been financed with low interest rate debt issuance. If rates rise, this is no longer an option. The "cash on the sidelines" story is true to some degree as total liquid assets as a percentage of total assets is near all time highs. However, corporations have relevered balance sheets to a large degree due to the cheap cost of debt. The chart below shows the ratio of cash to debt.
As far as cost cutting goes, much of that has come from reducing employment. However, as the chart below of full-time employment relative to the population shows, corporations have likely "milked that cow dry."
The problem is that the data suggests that artificially low interest rates and ongoing monetary interventions have been a key driver of both market returns and corporate profitability. However, what has been lacking is sustainable, organic, economic growth.
With this background, the consequence of a hike in overnight lending rates (Fed funds rate) will likely have far more significant impact on corporate profitability, economic growth and market returns than currently believed.
In order to support that conclusion a historical look at Federal Reserve actions can give us clues about future outcomes. The first chart below shows the fed funds rate as compared to economic growth.
What is interesting is that a case can be made that the Federal Reserve's monetary policies are potentially complicit in both economic booms and busts. When the Federal Reserve has historically begun raising interest rates the economy has slowed down, or worse. Subsequently, the Fed has to reverse its policies to restart economic growth.
It is significant that each time the Fed has lowered the overnight lending rate, the next set of increases have never exceeded the previous peak. This is due to the fact, that over the last 35 years, economic growth has been on a continued decline. I have detailed this declining trend in the Fed funds rate below as compared to the S&P 500.
Increases in interest rates are not kind to the markets either. I have highlighted, with the vertical dashed black lines, each time the Fed has started increasing the overnight lending rates. Each time has seen either market stagnation, declines, or crashes. Furthermore, it is currently implied that the Fed funds rate will increase to 3% in the future, yet the current downtrend suggests that an increase to 2% is likely all that can be withstood.
As I stated in yesterday's missive, I am currently fully allocated to the markets only because the markets are rising. However, it is important to understand investment risks are rising due to the changing fundamental environment. Rising interest rates will negatively impact earnings as borrowing costs rise, housing as mortgage costs increase, disposable incomes as debt costs rise, etc. With an economy that is nearly 70% driven by consumption there is little wiggle room for increased costs when incomes remain primarily stagnant.
My suspicion is that while Ms. Yellen stated that interest rates could rise as soon as 2015, it is possible that it will be far longer than that. That is unless we do somehow achieve an economic growth miracle starting six years into an ongoing recovery. Just because it has never happened in the past, doesn't mean it can't happen this time...right?
U.S. stocks rose after better-than- forecast data on leading indicators and regional manufacturing fueled optimism in the economy, overshadowing comments that interest rates may rise in the middle of next year.
Microsoft Corp. gained 2.4 percent after Morgan Stanley said the company’s anticipated Office software for Apple Inc.’s iPad could deliver $1.2 billion a year in billings. AT&T Inc. jumped 3.3 percent to lead a rally in phone stocks. Guess? Inc. slipped 4.9 percent after its full-year earnings projection trailed analysts’ predictions.
The S&P 500 gained 0.5 percent to 1,870.73 at 12:29 p.m. in New York. The Dow Jones Industrial Average added 113.12 points, or 0.7 percent, to 16,335.29. Trading in S&P 500 stocks was 2.5 percent above the 30-day average at this time of day.
“The market has digested and even discounted a bit what Yellen said, and put things into perspective,” Stephen Carl, principal and head equity trader at New York-based Williams Capital Group LP, said in a phone interview. “We have to see how the economy continues to move along. People are back focusing on signs of economic growth.”
The equities benchmark fell 0.6 percent yesterday after Federal Reserve Chair Janet Yellen said the central bank’s stimulus program could end this fall and benchmark interest rates could rise about six months later. The Fed had previously said it would not raise rates for a considerable period, without specifying a time frame.
Fed Stimulus
Quarterly Fed forecasts also showed more officials predicting that the benchmark rate, now close to zero, will rise to at least 1 percent at the end of 2015 and 2.25 percent a year later. The central bank said it would trim its monthly bond purchases by $10 billion to $55 billion.
Three rounds of Fed stimulus and low interest rates have helped boost the equity gauge as much as 178 percent from a 12- year low as U.S. stocks enter the sixth year of a bull market.
Yellen also said harsh winter weather was a significant reason for weakness this year in economic data from housing to jobs.
Data today showed the world’s largest economy will strengthen after the weather-induced slowdown in the first quarter, as the index of leading indicators rose more than forecast in February.
Data Watch
Jobs data today indicated the number of Americans filing applications for unemployment benefits held last week near the lowest level in almost four months, a sign the labor market continues to strengthen.
The Philadelphia Fed’s manufacturing gauge rose to 9.0 in March from minus 6.3 the prior month. The average estimate was for an increase to 3.2. Separate data showed purchases of previously owned homes declined in February to the lowest level since July 2012.
Investors also watched the situation in Ukraine, where the government in Kiev said yesterday it plans to reinforce its eastern border with Russia and withdraw troops from Crimea, ceding control of the Black Sea peninsula as tensions remained high over Russian moves to annex the breakaway region.
President Barack Obama said today the U.S. is imposing financial sanctions on a wider swath of Russian officials and a Russian bank as he authorized further penalties that would directly target sectors of the economy.
Volatility Gauge
The Chicago Board Options Exchange Volatility Index, a gauge for U.S. stock volatility, fell 2.1 percent at 14.81.
Eight of the 10 main industries in the Standard & Poor’s 500 Index advanced, with phone and bank stocks rising at least 1.3 percent to pace gains. AT&T jumped 3.3 percent, the most since January 2013, to $34.06 for the biggest jump in the Dow.
The KBW Bank Index jumped 2 percent before the results of annual reviews known as stress tests, due today and on March 26. The outcome may enable America’s lenders to unlock more than $75 billion that they hold in excess capital.
JPMorgan Chase & Co. rallied 2.8 percent to $59.93, the highest since 2000.
If the banks pass the Federal Reserve’s capital-planning simulations, they may increase their dividends and buybacks by 69 percent over the next 12 months, according to analyst estimates compiled by Bloomberg.
Microsoft gained 2.4 percent to $40.23, the highest since July 2000. Chief Executive Officer Satya Nadella is expected to debut a version of Office for the iPad at an event next week. Morgan Stanley maintained its equalweight view on the stock.
Guess declined 4.9 percent to $27.36 after forecasting earnings for fiscal-year 2015 of $1.40 to $1.60 a share, missing the average analyst estimate of $2.03 a share. The apparel maker predicted a first-quarter net loss of 5 cents to 9 cents a share.
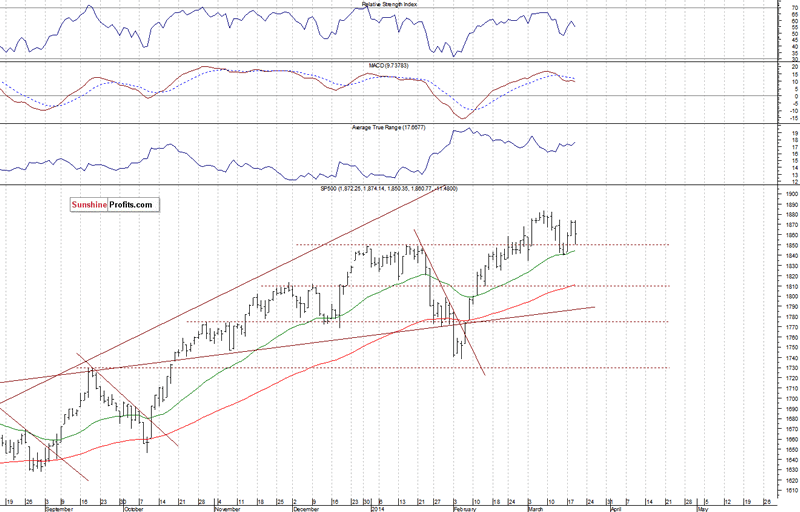
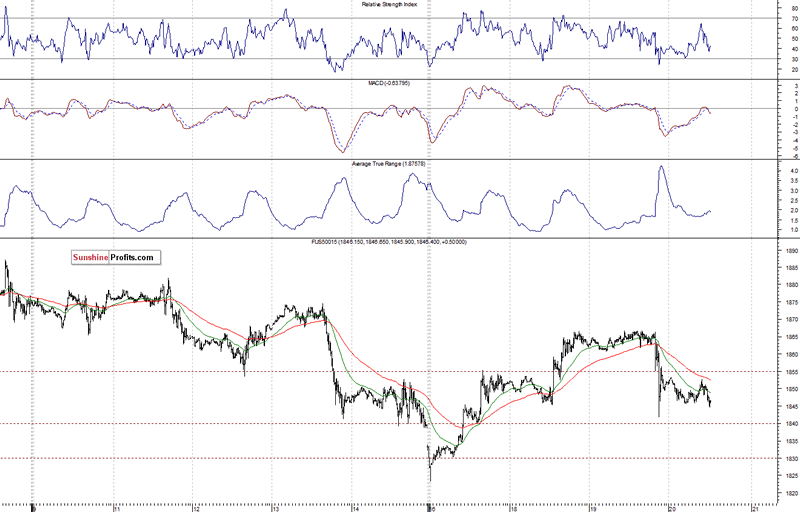
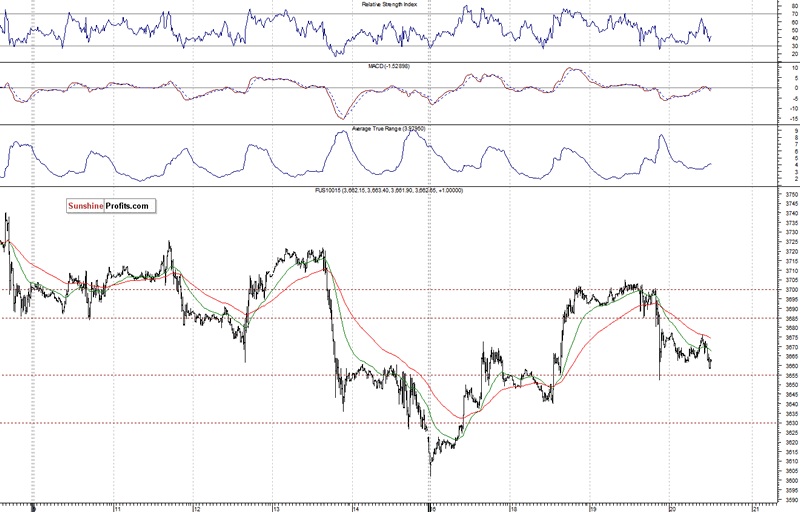
The U.S. stock market indexes lost between 0.6% and 0.7% on Wednesday, as investors reacted to the FOMC statement release. The S&P 500 index moved away from its March 7 all-time high of 1,883.57, extending few week long consolidation. The resistance remains at around 1,880-1,900, and the nearest important support level is at 1,840-1,850, marked by the recent local low, among others. There is no clear short-term direction, as we can see on the daily chart: Expectations before the opening of today’s session are negative, with index futures currently down 0.3%. The main European stock market indexes have lost 0.9-1.2% so far. Investors will now wait for some economic data releases: Initial Claims at 8:30 a.m., Existing Home Sales, Philadelphia Fed indicator and the Leading Indicators at 10:00 a.m. The S&P 500 futures contract (CFD) extends its consolidation along the level of 1,850, following a rebound from Monday’s low. The resistance is at 1,865-1,870, and the nearest support is at around 1,840, as the 15-minute chart shows: The technology Nasdaq 100 futures contract (CFD) bounced off the psychological resistance at around 3,700, as it trades along the level of 3,660. For now, it looks like a rather flat correction within short-term downtrend:
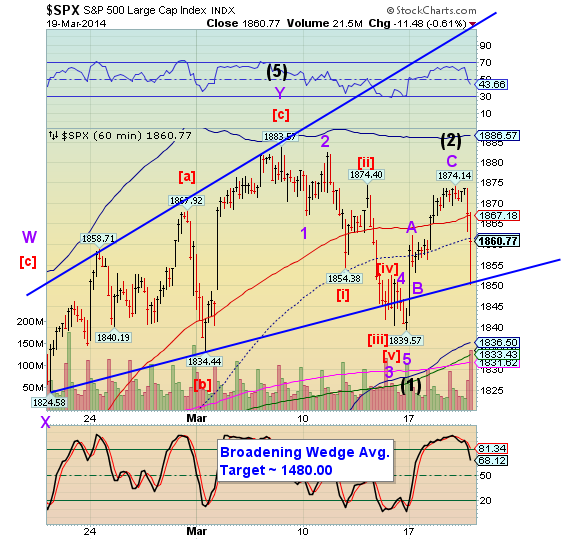
SPX has declined in the Pre-market to near 1856.00. That was expected as a high probability, since it had closed beneath mid-Cycle support/resistance at 1861.54. A break of the lower trendline of the Broadening Wedge at 1850.00 gives us the confirmed sell signal of that formation.
It is possible, based on the futures activity, that SPX may open beneath 1850.00. The VIX and Hi-Lo are both on sell signals, so we may see more downside action today, with rising volume.