Wednesday, July 13, 2011

Ugly European Price Charts

by Bespoke Investment Group

After bouncing nicely over the last two weeks following somewhat of a resolution to the Greece debacle, European markets have taken it on the chin this week as problems continue to spread. Below are the six month stock market price charts of three European Union countries that are also G7 countries -- Italy, France, and Germany. As shown, at its lows today, Italy's FTSE MIB was down 15.3% from its high on July 1st! France's CAC 40 was down 7.5% in three days at its lows today, and Germany's DAX was down 7% over the same time period. The post-Greece bounce for Italy has been wiped out and then some in recent days, while Germany and France are now right back to where they started before the bounce.


On another note, Brazilian equities continue to plummet. The country's major stock market index -- the Bovespa -- is now down 13.83% as we noted in our prior post, and the index is down 6.5% since July 4th. As shown below, the Bovespa is mired in a nasty long-term downtrend, and its current six-day losing streak has moved it to new six-month lows. So far, the announcements that Brazil would be hosting the 2014 World Cup and the 2016 Summer Olympics haven't done much to boost equity markets, that's for sure.


4 REASONS GERMAN EQUITIES WILL REMAIN THE BENEFICIARY OF THE EURO CRISIS

by Cullen Roche

The Euro has been particularly kind to one nation in particular. Germany. While many Germans have been quick to blame the periphery for the problems, the truth is that the core played a vital role in helping to lend to the profligate periphery. It’s because of this interconnectedness via the banking system that the core is hesitant to allow any defaults on the periphery. The ripple effect in the core could be extremely damaging. So, not only does the core have an incentive to stop any potential banking crisis via periphery banking crises, but they’ve also benefited enormously from the construction of the Euro. Germany, for instance, is experiencing a 19 year low in unemployment and has continued to see strong relative economic growth during the crisis.

Germany’s stock market has been no exception to these benefits. And in a recent research piece Credit Suisse cited 4 reasons why this outperformance is likely to continue:
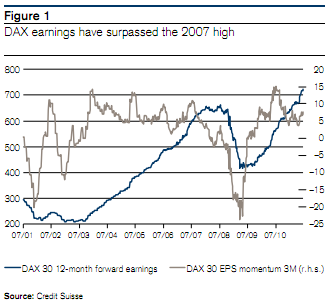
“This week, we feature Germany, which we have been recommending to overweight over the past few months and which we continued to do. We have four main reasons for being positive on Germany. First, we think German companies are likely to be able to pass on wage increases to their customers, and capacity utilization implies scope for price increases. Second, robust earnings growth and waning risk aversion opens scope for multiple expansion. Third, its has a high degree of cyclicality and export orientation, as the country is benefiting from large exposure to exports and emerging markets, as well as from a competitive level of the EUR. Germany strongly profits from global demand as its export share amounts to around 40% of GDP. And fourth, undemanding valuation in terms of traditional valuation multiples, especially in terms of market-implied valuations. If P/E ratios for the DAX were to revert to their historic average of 15 times 12-month forward earnings, the DAX would quote above 10,000 on current earnings, which are now above the 2007 highs (see Figure 1). We like Adidas, Allianz, BASF, BMW, Daimler, Deutsche Post, Fresenius Medical Care, Henkel pref., Infineon, SAP, Siemens and Volkswagen.”

Wheat Supplies Higher


U.S. wheat supplies for 2011/12 are raised 90 million bushels as higher carryin and production more than offset reductions in imports and higher use. Beginning stocks are raised 52 million bushels mostly reflecting higher estimated carryout for 2010/11 as reported in the June 30 Grain Stocks report. Production for 2011/12 is forecast at 2,106 million bushels, up 48 million from last month as higher winter wheat production and higher forecast yields for durum and other spring wheat more than offset lower area as estimated in the June 30 Acreage report. Partly offsetting is a 10-millionbushel reduction in projected imports with lower expected supplies in Canada. 

U.S. wheat usage for 2011/12 is raised with a shift in expected seed usage from 2010/11 and higher expected exports compared with last month. Seed use for 2011/12 is raised 7 million bushels as late planting in the Northern Plains shifted seed usage for the 2011 crop into the 2011/12 marketing year which began June 1. Exports are raised 100 million bushels with larger domestic supplies and reduced competition expected from Canada. Ending stocks are projected 17 million bushels lower at 670 million. While ending stocks remain adequate for most classes of wheat, durum stocks are projected to be especially tight with sharply lower area and production this year. The 2011/12 season-average farm price for all wheat is lowered 40 cents on each end of the projected range to $6.60 to $8.00 per bushel, mostly reflecting the sharp drop in projected corn prices this month.
 
Global wheat supplies for 2011/12 are projected 0.9 million tons higher as larger beginning stocks more than offset lower expected world production. Larger carryin in the United States and Russia accounts for most of the increase in 2011/12 world beginning stocks. Revisions to 2010/11 trade and usage for a number of other countries, based on the latest data, also affect world beginning stocks for 2011/12.
 
World wheat production for 2011/12 is projected down 1.9 million tons with reductions in Canada, Ukraine, and Mexico, more than offsetting increases for the United States, Turkey, and EU-27. Canada production is lowered 3.5 million tons as persistent heavy rains and flooding well into the second half of June limited planting opportunities for spring wheat in southeast Saskatchewan and southwest Manitoba. Production is lowered 1.0 million tons for Ukraine as persistent spring dryness in north central areas of the country stressed developing plants and appears to have limited vegetative growth and tillering. Production is lowered 0.4 million tons for Mexico based on the latest official reports. Turkey production is raised 1.1 million tons as abundant spring moisture boosted yields across the country. EU-27 production is raised 0.6 million tons as higher yields for Spain and Romania more than offset a reduction for Hungary.
 
Global wheat exports for 2011/12 are projected 2.4 million tons higher, mostly with higher expected exports from the United States and Russia. Imports are raised for EU-27, Egypt, Mexico, Japan, Sri Lanka, Malaysia, and Yemen. Partly offsetting are import reductions for the United States, South Korea, and Vietnam. Exports are raised for Russia as relatively low prices make Russian wheat competitive into North Africa and Middle East markets. Exports are also raised for Turkey with larger production. Exports are lowered for Ukraine reflecting the smaller expected crop. Lower exports from Canada are more than offset by higher exports from the United States.
 
Global 2011/12 wheat consumption is raised 3.0 million tons, mostly reflecting higher wheat feeding in EU-27, Russia, and Turkey, higher food use in Egypt, Japan, and Russia, and higher industrial use in Canada. Partly offsetting these increases are reductions in wheat feeding in Australia, Canada, and South Korea. Global ending stocks are projected 2.1 million tons lower with most of the decline expected in the Russia, Canada, and the United States.

Soybean Production Projections Down


U.S. oilseed production for 2011/12 is projected at 96.3 million tons, down 2.3 million tons from last month, with lower soybean production accounting for most of the change. Soybean production is projected at 3.225 billion bushels, down 60 million due to reduced harvested area.
 
Harvested area, estimated at 74.3 million acres in the June 30 Acreage report, is 1.4 million below the June projection. The soybean yield is projected at 43.4 bushels per acre, unchanged from last month. Soybean supplies are 40 million bushels below last month’s forecast as higher beginning stocks partly offset lower production. Exports for 2011/12 are reduced 25 million bushels to 1.495 billion reflecting lower U.S. supplies, increased supplies in South America this fall, and reduced global imports. U.S. soybean ending stocks are projected at 175 million bushels, down 15 million.
 
U.S. soybean exports for 2010/11 are projected at 1.52 billion bushels, down 20 million from last month in part reflecting lower projected imports for China. Soybean ending stocks for 2010/11 are projected at 200 million bushels, up 20 million.
 
The 2011/12 U.S. season-average soybean price is projected at a record $12.00 to $14.00 per bushel, down $1.00 on both ends of the range. Soybean meal prices are projected at $345 to $375 per short ton, down $30 on both ends of the range. Soybean oil prices are projected at 54 to 58 cents per pound, down 4 cents on both ends of the range.
 
Global oilseed production for 2011/12 is projected at 455.5 million tons, down 1.4 million from last month. Lower soybean, peanut, and rapeseed production estimates are only partly offset by increases for sunflowerseed. Global soybean production is projected at 261.5 million tons, down 1.3 million mostly due to lower production in the United States. Higher soybean production for Russia resulting from increased area partly offsets the U.S. reduction. Rapeseed production is reduced for Canada due to lower harvested area. Despite a record planted area estimate reported by Statistics Canada based on producer surveys conducted in late May and early June, much of the intended area in southeast Saskatchewan and southwest Manitoba did not get planted due to excessive moisture through late June. As a result, the Canada rapeseed crop is projected at 12.6 million tons, down 0.4 million from last month. Other changes include increased rapeseed production for Russia, increased sunflowerseed production for Russia and Ukraine, and reduced canola, cottonseed, and peanut production for the United States.

Total Meat Production Lowered


LIVESTOCK, POULTRY, AND DAIRY: The forecast for 2011 total meat production is lowered from last month as lower beef production more than offsets higher expected pork and turkey production. Beef production is lowered as steer and heifer slaughter in the second quarter was lower than expected although more cows were slaughtered. In addition, recent placements of lighter-weight cattle are expected to moderate carcass weight growth during the year. The 2011 pork production forecast is raised on larger fourth-quarter slaughter. Broiler production for 2011 is unchanged as higher secondquarter production is offset by lower forecast production in the fourth quarter. Turkey production is raised largely on higher second-quarter production. No change is made to table egg production but hatching egg production is lowered due to a stronger forecast decline in last-quarter broiler production.
 
For 2012, meat production forecasts are reduced as a sharper reduction in the broiler production forecast more than offsets higher pork and turkey production. Larger cutbacks in broiler production are expected to carry into 2012 before production increases gradually later in the year. The pork production forecast is raised slightly, driven primarily by gains in pigs per litter. Despite higher forecast hog prices, producers are expected to remain cautious in expanding farrowings. Egg production forecasts for 2012 are reduced on less demand for hatching eggs.
 
A small increase is made to the export forecast for beef in 2011 but no changes are made to pork or broiler exports. For 2012, pork exports are raised, but no changes are made to either beef or broilers. No changes are made to beef, pork, or broiler imports for either 2011 or 2012.
 
Cattle and hog prices are forecast higher for 2011 but forecast broiler prices are lowered as large supplies are pressuring prices. For 2012, cattle price forecasts are unchanged. Hog price forecasts are raised as demand strength carries into 2012, but price gains will be moderated by higher production. Broiler prices are raised slightly as 2012 supplies are forecast to be tighter.
 
Milk production forecasts for 2011 and 2012 are raised. Cow numbers are forecast higher as higher milk prices and lower forecast feed prices support further herd expansion, but milk per cow is unchanged from last month. Commercial exports on a fat basis are forecast higher for 2011. Ending stock forecasts are raised as cheese stocks are larger than expected.
 
Dairy product price forecasts for 2011 are raised from last month. The Class III and Class IV price forecasts are raised from last month in line with increased product prices. The all milk price is forecast at $20.00 to $20.30 per cwt for 2011. For 2012, the butter price is forecast slightly higher than last month, but forecasts for other products are unchanged. Class price forecasts are unchanged. The all milk price forecast for 2012 is unchanged at $17.75 to $18.75 per cwt.

See the original article >>

USDA Mixed To Bullish News for All Commodities

By: Marc Schober

The USDA updated the U.S. and World balance sheet estimates for major agricultural commodities in the World Agricultural Supply and Demand Estimates (WASDE) report today. WASDE reports in the summer are a barometer of overall world demand, forecasted production, and inventory adjustments. In July, U.S. ending stocks for 2011/12 were revised higher for corn, but decreased for soybeans and wheat.

Corn

Mixed news for the U.S. corn market continues after the surprise USDA June 30th Acreage and Grain Stocks report, as the 2011/12 U.S. projections for beginning stocks, production, usage, and ending stocks were all increased from their June estimates.

The USDA raised beginning stocks 150 million bushels reflecting changes made to the 2010/11 usage projections. After the surprising June 30th Acreage report, an additional 1.7 million harvested acres were added in the July estimates. Yield estimates remained flat from June, causing the 2011/12 production estimate to be increased by 270 million bushels to 13,470 million bushels.

Domestic usage for the 2011/12 corn crop was revised to 11,600 million bushels, an increase of 145 million bushels. Feed and residual use for 2011/12 was increased 50 million bushels, caused by larger than expected supplies and lower expected prices. Corn use for ethanol was increased to 5,150 million bushels or 100 million bushels due to larger supplies and an improved outlook for ethanol producer margins. Other domestic uses for corn were decreased by 5 million bushels. Exports were raised in July to 1,900 million bushels or 100 million bushels, reflecting increased demand from China.

Compared to the June WASDE, ending stocks for 2011/12 corn crop are now projected to be 175 million bushels higher at 870 million bushels, but below consensus estimates of 1,000 million bushels. The 2011/12 season-average farm price for corn is projected at a record $5.50 to $6.50 per bushel; however, compared to the June report this represents a 50 cent reduction on both ends of the range.

World corn beginning stocks, production, and imports were all revised slightly higher by 3, 6, and 1 million metric tons respectively. Increases in U.S. beginning stocks and production coupled with increases in Chinese imports accounted for 100% of the increases. Global corn ending stocks were increased by 3% to 116 million metric tons; this is represented by increases in global usage being unable to maintain pace with increases in production.

Soybeans

The USDA raised beginning stock levels by 20 million bushels reflecting changes made to their 2010/11 usage projections. Exports were revised lower reflecting lower than expected imports from China for the remainder of 2010/11. Planted and harvested soybean acres were lowered by 1.4 and 1.6 million acres respectively to 75.2 and 74.3 million acres respectively, while yield estimates remained flat from June. These adjustments resulted in lowering production estimates for 2011/12 by 60 million bushels to 3,225 million bushels.

The USDA also lowered its estimate for exports during the 2011/12 year by 25 million bushels to 1,495 million bushels. Export reductions were the result of lower than anticipated U.S. production, increased production from South America, and an overall reduction in global imports. U.S. soybean ending stocks are projected at 175 million bushels, 15 million bushels lower than the June report, but above consensus estimates of 162 million bushels.

The U.S. season-average soybean price for 2011/12 is projected at $12.00 to $14.00 per bushel, down $1.00 on both ends of the range.

Global soybean supplies and usage were each lowered marginally from the June report, while ending stocks increased by less than 0.4 million metric tons. Offsetting lower U.S. production and export estimates were lower than expected usage and import estimates from China.

Wheat

U.S. 2010/11 wheat ending stocks were raised to 861 million bushels from 809 million bushels. This estimate is based on a higher than expected carryout for 2010/11 as reported in the June 30th Grain Stocks report. The USDA again raised forecasts of 2011/12 wheat yields to 44.6 bushels per acre, from 43.1 bushels per acre, but lowered its planted and harvest acres by 1.3 and 0.6 million acres respectively. Estimates for wheat usage and exports for 2011/12 were increased by 7 and 100 million bushels respectively. These estimates project ending stocks to be 17 million bushels lower at 670 million bushels, below consensus estimates of 702 million bushels.

Estimated global wheat supply for the 2011/12 year was increased by 2.96 million metric tons to 978.74 million metric tons. Decreases in global production were offset by higher than previously expected beginning stock levels and import estimates. Compared to June, global wheat usage was raised by 6.75 million metric tons to 923.2 million metric tons. These adjustments resulted in lowering ending stocks by 2.07 million metric tons to 182.19 million metric tons.

The 2011/12 season-average farm price for all wheat is projected at $6.60 to $8.00 per bushel, down 40 cents on both ends of the range, reflecting the decline in projected corn prices this month.

Overview

Even though the USDA raised 2011/12 beginning stock levels for its three major commodities, we are closely monitoring demand and basis levels for all commodities but especially old crop corn. Recent declines in commodity prices could spark buying interest from producers who have not hedged their late summer/early fall production. A large wave of domestic or international purchases could diminish stocks further than the USDA forecasts; this could result in rising commodity prices over the next quarter.

We are also looking forward to the August 11th USDA Production report, which is going to recertify the June 30th Acreage report. Following the initial report the USDA announced they were going to resurvey certain grain producing states because at the time of survey, a large percentage of acres remained unplanted. This could also spark a strong reaction from the market if planted acres change dramatically.

Pay attention to crop conditions during pollination and grain fill, end-user demand, and weather patterns as the summer progresses. As grain prices could regain a tailwind and continue their historical climb higher.


Follow Us