By Greg Weldon
Today’s Money Monitor theme can be pitched two ways …
… D.O.A. = Dead on Arrival …
… or … D.O.A. = Debt Offenders Anonymous
Either way, the title applies to our examination of the still-intensifying EU debt-deficit debacle. We are tempted to say that the Eurocurrency is currently being rushed to the hospital, and that it is likely to be pronounced ‘D.O.A.’, or dead-on-arrival …
… but we think the more ‘appropriate’ analogy is to look at the EU as if it were a prime candidate to join a twelve-step self-help program called D.O.A., or ‘debt-offenders-anonymous’.
The first step would be ‘acceptance’.
However, the EU is not yet capable of this, as it remains ‘in denial’.
As EU debt markets come under renewed pressure amid a broadening in the scope of downgrades to sovereign credit ratings, and ratings outlooks, we note commentary from the Union’s Economic and Monetary Affairs Commissioner Olli Rehn …
… “We have contained the crisis to the three countries now in the EU-IMF programs. It is not correct to speak of a crisis of the euro or monetary union.”
DENIAL, case closed.
EU officialdom, via their denial, continues to be an ‘enabler’.
Of course, a symptom almost always attached to an ‘addict’, is lying … by the addict, AND by the co-dependent enabler.
Thus we find it MOST interesting to observe last week’s startling admission from the head of the EU Finance Ministers, Luxembourg’s Jean-Claude Juncker, who stated that he “LIED’ to the press and the public, regarding a secret meeting of top EU officialdom, held to discuss the Greek situation …
… “It was done in the interest of the people who use the euro as their common currency. The denial immediately prevented further speculation in the markets. Speculation about an exit by Greece from the euro-zone had to be avoided at all costs, in the interest of the euro-zone.”
Denials and lies — this has become the EU’s arsenal.
The reality is … the EU is unwilling to accept the fact that it has become addicted to debt and deficits, and that their fiscal life has become ‘unmanageable’. The EU must first admit to themselves, and to the markets, the exact nature of their wrong-doing.
Without acceptance, the EU cannot reach the point where they can make a conscious decision to turn over their ‘will’ to a ‘higher power’, which in this case would be ‘fiscal austerity’, and a restructuring of debt that will allow the situation to become ‘manageable’.
Without acceptance, the EU cannot even think about ‘making amends’.
The EU (along with the US) is in desperate NEED of a ‘spiritual awakening’.
The problem is one linked to our instinctive nature as human beings …
… a thing called … the desire to avoid pain, at any cost.
The EU, like the US, suffers from what we might call the ‘Cyrenaic Syndrome’, a dynamic linked to the ancient Greek philosophers Aristippus and Hegesias of Cyrene, who, in 3rd and 4th Centuries BC, hypothesized that the goal of life was the avoidance of pain and suffering. Addicts accomplish this thru substance abuse. The EU is trying to accomplish this thru pure denial, and an outright refusal to accept that austerity, like sobriety, is the ONLY way to actually deal with the problems it faces.
The EU is still … FAR … from ‘hitting bottom’.
For SURE … the debt-deficit crisis is NOT “contained”, as Olli Rehn would have us believe. We have been pounding the table for years, screaming that the problems facing Greece, Ireland, and Portugal, will look like CHILD’S PLAY, when the situation in Belgium, Spain, and Italy, begins to take center stage. This is NOW HAPPENING, on the back of today’s outlook downgrade placed on Belgium and Italy, in synch with intensified anxiety linked to Spain following weekend elections in which the ruling Socialist party got mauled.
At the heart of the issue in Spain, and Greece, is rising unemployment. Indeed data released last week in Greece revealed a jump to yet another new high in the Unemployment Rate, as seen in the chart. The Unemployment Rate jumped to 15.9% in February (data lagged by one-month), up from 15.1% in January, and up from 12.1% in Feb-2010. Worse yet, the Number of Unemployed has now spiked higher by +30.1% versus last February, and is up by a mind-numbing +99.9% versus February of 2008.
We also shine the spotlight on data released by the Greek National Statistics Service two weeks ago revealing that Industrial Production contracted by (-) 8.0% year-over-year during the month of March, plummeting deeper into negative territory versus the decline of (-) 4.8% yr-yr posted in February …
… LED by a double-digit decline in the year-year rate of Manufacturing Output, which plunged by (-) 10.3% during March, sliding from a (-) 6.8% yr-yr contraction in February, and the (-) 4.5% yr-yr decline seen in January. Evidence the chart on display below, which speaks for itself.

Further, we note today’s report on the Greek Budget, revealing that DESPITE austerity measures undertaken as part of the EU-IMF directed program, the Deficit WORSENED during the month of April. Indeed, the government reported a deficit of (-) EUR 7.246 billion in the four-month YTD 2011, an ‘increase’ of +13.7% versus the same period 2010.
Worse yet … Revenue FELL, while Spending ROSE … with Revenue falling by (-) 9.1% in the YTD-yr-yr, and Spending rising by +3.6%.
Problematic for SURE … as a rise of +14.4% in Outlays linked directly to Interest Payments on the debt, which accounted for a MIND-BLOWING 52.7% of the TOTAL DEFICIT in the year-to-date, pegged at (-) 3.819 billion EUR.
Unfortunately, Greek bond yields continue to SOAR, reaching a new ALL-TIME HIGH TODAY, as evidenced in the chart below, wherein the 2-Year Bond yield now exceeds 25%.

Turning to Spain, we note that the ruling Socialist Party got crushed in regional elections, falling victim to promises made by the People’s Party that they will move to restructure the electoral process, and squash planned cuts to social spending programs.
Perhaps more troubling is the fact that the United Left Party, formerly the Spanish Communist Party, saw a significant rise in support from a disenchanted populous, in line with massive protests among the youth in the country last week, who reject thoughts of … austerity.
Subsequently, we continue to closely monitor the action in the Spanish Government Bond market, with focus on the line-drawn-in-the-sand at 5%, as evidenced in the chart on display below plotting the country’s 5-Year Sovereign Bond yield. Clearly, from a technical perspective, a rise in this bond’s yield thru the double-top marked at 4.93%-4.95% would constitute a major upside breakout, and would come in synch with the upside acceleration taking place in the long-term trend defining 200-Day EXP-MA.

Similarly, we observe the chart shown below in which we plot the 5-Year Sovereign Credit Default Swap Rate linked to Spain’s government’s credit worthiness. We focus on the upside push taking place today, and the violation of the highs reached last May, in line with the upside directional reversal by the long-term 200-Day EXP-MA.

We have repeatedly stated that Greece, Ireland, and Portugal represent the minnows in the debt-deficit pond, while Spain and Belgium might be considered big-fish.
But, when it comes to Italy, we have used the term WHALE to describe the country and the risk attached to their HUGE outstanding debt, pegged at more than $2 trillion (including interest payments). With that in mind, we shine the spotlight on today’s downgrade to Italy’s credit rating outlook, instituted by Standard and Poor’s, with specific focus on commentary from the agency …
… “In our view, Italy’s current growth prospects are weak, and the political commitment for productivity-enhancing reforms appear to be faltering, and potential political gridlock could contribute to fiscal slippage. As a result, we believe Italy’s prospects for reducing its general government debt have diminished. If one or a combination of these risks materializes, Italy’s general government debt could stagnate at current high levels. In this case, we may lower the long- and short-term ratings on Italy.”
Subsequently, Italian Government Bond yields rose sharply today, with the 2-Year Bond moving above 3%, and the 5-Year yield spiking upwards to more than 4% … amid a widening in the spread over Germany’s comparable 2-Year Schatz yield, and the German 5-Year BOBL yield. We note the 5-Year spread in the chart on display below, with focus on the fact that Italy’s yields are threatening to breakout to the upside, while German yields actually fell today, amid a flight to safety among regional bond investors.

We are keen to watch the price action in the Italian 10-Year BTP futures contract, as noted in the chart below, with thoughts of being short amid the downside violation of the 100-Day EXP-MA, and the fresh sell signal being generated by the med-term Oscillator.

Against the negative backdrop of ratings news, macro-economic weakness, and overt denial by EU officialdom …
… we examine the chart on display below plotting the Italian MIB Stock Index, which PLUNGED by (-) 3.32% in today’s trading session, producing THE SINGLE LARGEST one-day LOSS of ANY industrialized nation, and trailing only Vietnam (down -3.48%) and Bangladesh (down -5.98%) as the day’s largest losers in the world, stock market wise.
More importantly, we note the technical damage inflicted on the Italian stock index during today’s trading session. We evidence the downside violation of the uptrend line that has defined the bull market run since the 1Q of 2009, in synch with the move below the March swing low, and the penetration of the long-term 200-Day EXP-MA (which has completed its downside directional reversal). A further decline below the May-25th 2010 low marked at 18,382 would constitute a full-blown breakdown.

The Spanish stock market got whacked as well, losing (-) 1.42% and taking out its March low. As noted in the chart below, the Spanish IBEX stock index is highly correlated to the German DAX, and tends to lead the German market. Indeed, both the Italian MIB and the Spanish IBEX are now threatening to lead the German market to the downside.

As such, we are becoming increasingly bearish on the DAX, in synch with the weakness exhibited by the Spanish and Italian equity markets. We shine the spotlight on the long-term weekly chart of the German DAX, shown below, with specific focus on the significant degree of bearish momentum divergence exhibited by the 52-Week Rate-of-Change indicator, and the long-term Oscillator, neither of which ‘confirmed’ the most recent newer new high in the underlying index itself.
Moreover, we note that both the long-term Stochastic indicator and the long-term Oscillator have generated renewed ‘sell signals’, via their dual downside rollovers. Subsequently, the door has been opened for a move to test the swing low set on March-16th at 6,412 (basis the nearby futures contract). A violation of this key technical support pivot would also cause a downside penetration of the long-term trend defining 52-Week EXP-MA, last marked at 6,792.

But there is a ‘bigger picture’ risk in play here, as ALL the addicts are at risk, the debt addicts, and the dollar-debasement/excess-liquidity addicts, as evidenced in the overlay chart on display below. We plot the path of the Spanish IBEX (blue), the German DAX (black), along with the US S+P 500 Index (purple), and the CRB Index of commodities prices (red).

I
n fact, Fed monetization driven ‘Dollar Debasement’ has been like ‘smack’ to the asset market … without it … withdrawal could be UGLY.
We note the high degree of correlation between dollar depreciation, as defined by the green bars plotted in the overlay chart shown below, representing the inverted price of the US Dollar Index (inverted to reflect a rise, when the value of the dollar declines) …
… and … the European stock markets, as represented by the German DAX (black line) and the Spanish IBEX (blue line).

With the Fed threatening to pull their debt monetization support for a continued debasement in the value of the USD … the time for DENIAL is running short. We will be keeping an EKG attached to the Eurocurrency, seen in the daily chart below, to determine if it might be, DOA, or dead-on-arrival. We focus on today’s technical breakdown, with a violation of the med-term trend defining 100-Day EXP-MA, completion of a head-and-shoulders topping pattern, and the bearish divergence in, and preliminary sell signal offered by, the med-term Oscillator.

Debt addicts are in denial, and monetary officialdom’s enablers have shown a willingness to LIE, in order to provide protection from reality.
Dollar debasement addicts are also in denial, if they believe that there is NO pain to be felt in ALL asset markets, if the USD’s multi-month trend towards depreciation is in the process of reversing, in line with a breakdown in the Eurocurrency.
If Europe is NOT willing to feel some pain, fiscally …
… the markets will INFLICT PAIN, in the form of lower equity quotes, and higher bond yields.
Within the context of our Macro-Global Discretionary Managed Accounts Trading Program, we are bearish on European stock markets, and are becoming increasingly interested in the bearish side of the US equity market.
We are bearish on bond markets linked to fiscally challenged countries, against a bullish stance on the US and German bond markets.
We are bullish on the US Dollar Index … and bearish on the EUR, along with the Canadian Dollar.
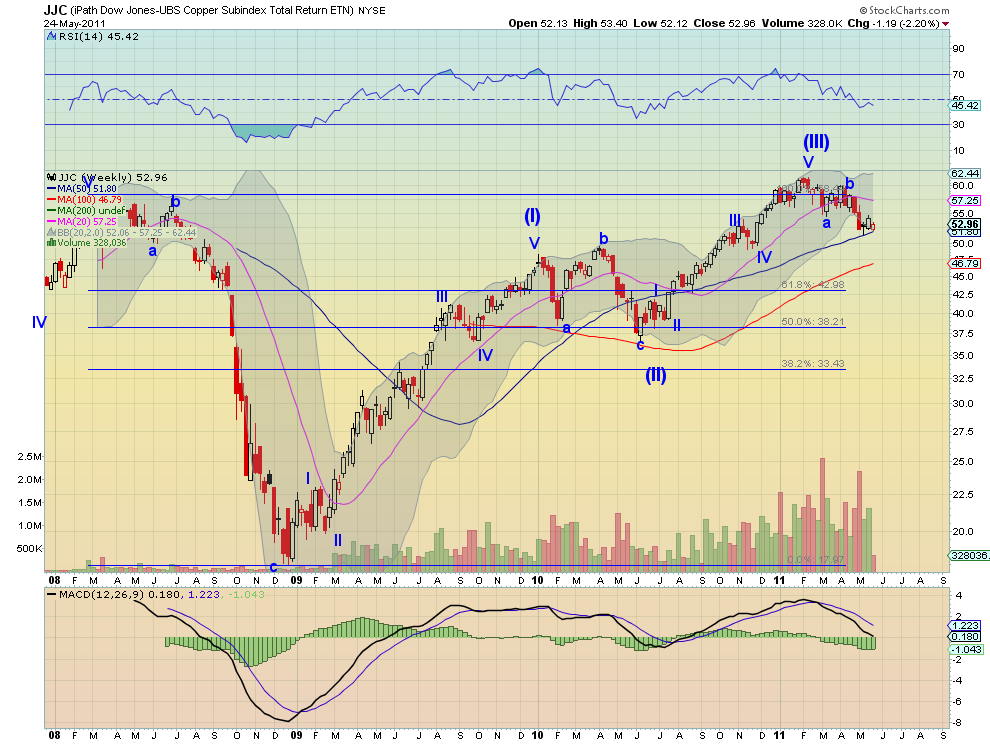
And, we are bearish on select commodity markets, with specific focus on the Industrial Metals sector (with focus on Copper, Nickel, Lead, Zinc, and Palladium) along with the Tropical-Soft sector (focusing on Sugar, Cocoa, Cotton, and Coffee).
See the original article >>