Thursday, July 18, 2013

Bernanke’s Hidden Hint of the Coming Economic Collapse

by Graham Summers

Today marks the final day of Bernanke’s testimony to Congress.

Highlights from the first day of testimony and Q&A include:

    Q: Are You Printing Money?

    Bernanke: Not Literally

Amazingly, no one said anything after this comment. But far more importantly was the last statement made by the Fed Chairman,

“If we were to tighten (monetary) policy, the economy would tank.”

Tightening monetary policy means if interest rates rise. Interest rates are currently being held at ZERO and have been there four nearly five years. And Bernanke has just announced that if interest rates rise, at all, then the economy would tank.

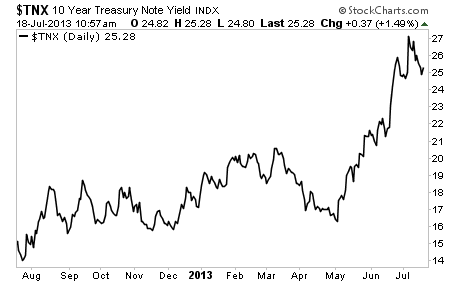
Unfortunately for Ben, rates are already rising around the world. Rates on Portugal’s ten-year are over 7%. Rates on Greece’s ten-year are back over 10%. Japan, the country of zero interest rates has seen a spike in its rates since April. Even Treasuries are surging higher, despite the Fed buying $45 billion worth of them every month.

Bernanke has told us point blank what will happen if rates rise (economic collapse). But he’s not telling us the whole truth. The fact of the matter is that if rates rise now while the Fed is running QE 3 and QE 4 then it’s game over. The Fed will have officially lost control of the system and a wave of defaults will implode the markets.

This process has already begun. As I noted before we’re seeing rates spiking around the world.

Stocks may hit new highs, but this rally has all the hallmarks of a blow off top, coming at the final stage of a bubble. Indeed, stocks have not been this overextended in over 20 years… that includes the 2007 peak. Soon after we reached that point… we then plunged into one of the worst market Crashes of all time.

By today’s metrics, this would mean the S&P 500 falling to 1,300 then eventually plummeting to new lows.

This is not doom and gloom. This is a fact. The Fed has created an even bigger bubble than the 2007 one.

See the original article >>

Are we there yet? Is Dow 16,000 an 800 pound resistance point?

by Chris Kimble

CLICK ON CHART TO ENLARGE

What do you get if connect these key "Emotipoints" (Emotional highs and lows)... The 1982 low, 1987 High, 2000 high, 2002 low, 2003 low and 2007 high together? 

You get a rare combo of resistance coming into play at Dow 16,000. As of this morning the Dow is now less than 500 points (less than 3%) from this potential key technical price point.

From a trend/momentum perspective the Dow is above key moving average and the advance decline line is healthy at this time.  Will this rare cross roads of "Emotipoints" dating back to President Reagan some how impact the markets?  I don't know at this time.

From a technical perspective, if the Dow does break above all this resistance, it has to be viewed as a big positive!

See the original article >>

Chinese growth set for lower lows

By Mark A. DeWeaver

China is slowing fast.  Since hitting a post-financial crisis high of 11.9% in the first quarter of 2010, Chinese quarterly GDP growth has risen in just two of the subsequent 13 quarters.  The latest figure of 7.5%, for the second quarter of this year, is down from 7.7% in the first quarter and 7.9% in the last quarter of 2012.

This downtrend is set to continue into the second-half.  Beijing has just launched a new campaign to rid the Party of “formalism, bureaucratism, hedonism and extravagance.”  This will stifle both consumption and investment for at least the next two quarters.

Beijing’s economic planners are in a bind.  High levels of excess capacity have reduced the return on investment to the point where China’s traditional investment-led growth model is no longer viable.  Yet this is the only model that the country’s economic institutions can support.

The obvious way forward would be to dismantle these institutions by privatizing state-owned assets and radically reducing the role of the state in the economy.  But this is a solution that Secretary General Xi Jinping has explicitly ruled out.  He is instead relying on stricter discipline of Party members to make the existing system more efficient.  Genuine reform is not really on the table.

This approach will do little to incentivize better economic decision making.  In the short term, officials will take cover as they wait for the storm to blow over.  Few will dare to promote obvious “white elephants” or to indulge in public displays of conspicuous consumption.  Sales of cement, steel, Rolex watches, and shark’s-fin soup will be poor.

But there will be no long-term gain for this short-term pain.  China’s economic problems are not primarily the result of immorality on the part of individual Party members or an imperfect understanding of national priorities at the local level.  They are an unavoidable consequence of state ownership and bureaucratic management.  The current “rectification” drive, with its focus on prosecuting corrupt officials and studying Marxist classics, might temporarily treat some of the symptoms but will not cure the disease.

The campaign will certainly do nothing to weaken the state’s economic power.  This means that competition among government officials will continue to be more important than market forces.  Even if new performance evaluation criteria are introduced—as Secretary General Xi has recently suggested—hitting targets will still take precedence over economic rationality.  Transitioning to productivity-led growth will be impossible under these circumstances.

Continued state sector dominance also will stifle consumer demand.  The low share of consumption in Chinese GDP is not primarily the result of household “over-saving.”  It is due instead to the fact that ordinary citizens have no real claim to the income of state-owned entities.  In fact, state-sector profits derive largely from subsidies, the burden of which ultimately falls on households.  As long as this is the case, the consumer can hardly be expected to “step up to the plate.”

China’s economic system, like the Soviet system on which it is based, is designed to channel national income into state-promoted investment.  In the initial phases of economic development, this strategy can work because it is relatively easy for planning authorities to identify investment projects that make sense on a cost-benefit basis.  Productivity growth is relatively unimportant and a case can be made for postponing consumption for the sake of rapid industrialization.

In China, this “big push” phase could be said to have ended in the late 1990s, when excess-capacity problems emerged in many sectors that had previously experienced excess demand.  The country had reached a point at which, as then-premier Zhu Rongji told the National People’s Congress in 2001, “further development would be impossible without structural adjustment.”

Yet structural adjustment has proved elusive.  As the Soviets discovered in the 1980s, a productivity renaissance cannot be brought about by fiat.  Nor are government and state enterprise elites going to allow a significant reduction in the state’s share of the national income pie.  As long as the economy is dominated by the state, switching to a new “mode of growth” is not a real possibility.

China is now facing a sustained deceleration.  In the absence of any other driver, GDP growth is not going to pick up until investment recovers.  But with the return on investment continuing to decline, such a recovery will prove to be short-lived.  Before long, Beijing will once again have to take up the battle against corruption and inefficiency, pushing growth rates even lower in the process.

See the original article >>

Capitalize On Crude Oil's Breakout

by Tom Aspray

Stocks managed solid gains again on Wednesday as the much better than expected earnings from Bank of America BAC +2.73% (BAC) increased the enthusiasm for stocks. Testimony by Fed Chairman Ben Bernanke was also reassuring as he repeated that there was no firm timeline for stopping the stimulus. Yields declined further in reaction to his comments which was inline with the technical outlook.

The market internals were solidly positive with advances leading declines by a 2-1 margin. This has stalled the slight deterioration noted after Tuesday’s close. Housing starts dropped 9.9% and hit the lowest level since last August. Economists were way off the mark as they were looking for some slight improvement.

One of the more interesting developments this month was the breakout in crude oil from a several-month trading range as the $100 level was overcome. Despite much lower than expected inventories in Wednesday’s EIA report, crude oil was just slightly higher Wednesday but is up in early trading Thursday.

Though the weekly relative performance for the energy sector has not yet completed its bottom formation, several oil stocks are now back to support where it appears they are being accumulated. This should be a good opportunity to add some energy exposure to your portfolio as crude oil should be even higher by year end.

chart
Click to Enlarge

Chart Analysis: The daily chart of crude oil futures shows the July 3 completion of a four-month trading range, lines a and b.

  • Crude testing its daily starc+ band last week so the recent sideways action was not surprising.
  • The formation has an upside target and the next weekly resistance at the March 2012 high of $110.55.
  • Of course in May 2011, crude oil hit a high of $114.83 based on the continuous crude oil contract.
  • The daily OBV had held above support during April’s sharp drop.
  • The OBV confirmed the price action by moving through its corresponding resistance at line c.
  • The weekly OBV (not shown) is also positive.
  • There is initial support in the $104.20 area with the rising 20-day EMA now at $102.24.

Valero Energy VLO -0.51% Corp. (VLO) is a $19.1 billion independent oil and gas refiner that has been correcting since its March highs of $48.93.

  • At the early July low of $33.00, it was down 32% from its high.
  • The daily chart shows a potential short-term bottom formation, line e, that should be completed with a move above $36.18.
  • The daily downtrend, line d, and the 38.2% Fibonacci resistance is at $39.13.
  • The 50% retracement resistance is at $41.03.
  • The relative performance moved above its WMA last week and looks ready to break its downtrend, line f.
  • The daily OBV has pulled back to test its flattening WMA and appears to have bottomed, line g.
  • Minor support is now at $34.50 with further at $33.40.

chart
Click to Enlarge

EPL Oil & Gas EPL +0.1% Inc. (EPL) is a $1.18 billion independent oil and gas company that reports earnings on July 29.

  • EPL rallied sharply from the June lows on June 21 as an HCD was triggered.
  • The rally stalled at the resistance in the $31.80-$32.10 area, line a.
  • There is stronger resistance in the $34.44 to $35.14 area.
  • The relative performance held above the long-term support at line d, on the recent correction.
  • The RS line needs to move above the resistance at line c, to confirm that it has bottomed.
  • The volume was very strong on the rally from the June lows as the OBV moved above its WMA ands then broke its downtrend, line e.
  • There is initial support at $28.75 with more important at $27, line b.

Phillips 66 (PSX) is a $35.94 billion oil and gas marketing and refining company, which reports earnings on July 31.

  • PSX peaked at $70.52 in April and hit a low on July 3 at $54.80.
  • This was a correction of 22% from the highs as the major 38.2% Fibonacci retracement support was tested (line g).
  • The relative performance did confirm the April highs before dropping below its WMA.
  • There is longer-term resistance for the relative performance at line h.
  • The on-balance volume (OBV) shows a positive zig-zag formation but need a good volume up day to bottom out.
  • The OBV has major resistance at the downtrend, line i.
  • The recent bounce failed at $59.85 with further resistance at $61.74, which was the quarterly pivot.
  • There is stronger resistance now in the $65 area.

What It Means: The sharply higher crude oil prices suggest an increased demand, which is consistent with the growing global demand.

The volume pattern is the strongest for EPL Oil & Gas Inc. (EPL) but a stop needs to be under Tuesday’s low.

Having taken some very nice profits in Valero Energy Corp. (VLO) earlier in the year, I would look to buy near current levels, but I would wait for a deeper pullback or confirmation of a bottom in Phillips 66 (PSX).

I do not see any good-entry strategies right now for either the SPDR S&P Oil and Gas Exploration ETF (XOP) or the Select Sector SPDR Energy (XLE).

How to Profit: For EPL Oil & Gas Inc. (EPL), go 50% long at $29.86 and 50% at $29.34, with a stop at $28.13 (risk of approx. 5%).

For Valero Energy Corp. (VLO), go 50% long at $34.90 and 50% at $34.11, with a stop at $32.84 (risk of approx. 4.7%).

For Phillips 66 (PSX), go 50% long at $56.64 and 50% at $55.44, with a stop at $54.19.
(risk of approx. 3.3%).

See the original article >>

Cotton falls as rain reported in key producing areas

By Jack Scoville

COTTON (NYBOT:CTV13)

General Comments: Futures moved lower on reports of rain in Texas. Temperatures are much cooler in Texas and rain was reported in central and western parts of the state, including key cotton producing areas. The rains there are called very beneficial. Some showers are possible in the next couple of days. Conditions in Alabama, Mississippi, and Missouri are below average now, but will see warm temperatures and some showers this week, with most of the precipitation in eastern and southern areas. Some rain and cooler temperatures are possible this weekend. It is possible that futures can continue to work lower as demand has turned soft and as the weather is getting better in almost all US production areas. Weather for Cotton appears good in India, Pakistan, and China.

Overnight News: The Delta and Southeast will see showers and storms develop this weekend. Temperatures will average near to above normal. Texas will see drier weather this week and this weekend. Temperatures will average near to above normal. The USDA spot price is now 79.80 ct/lb. ICE said that certified Cotton stocks are now 0.518 million bales, from 0.540 million yesterday. USDA said that net Upland Cotton export sales were 50,400 bales this year and 40,100 bales next year. Net Pima sales were 4,800 bales this year and 5,300 bales next year.

Chart Trends: Trends in Cotton are down with objectives of 83.00 October. Support is at 84.00, 83.10, and 82.80 October, with resistance of 85.50, 86.00, and 86.50 October.

FCOJ (NYBOT:OJU13)

General Comments: Futures closed higher and made new highs for the move. Some more buying is possible this week. There is not much new surrounding the FCOJ market these days, and the tropics remain quiet for now. Growing conditions in the state of Florida remain mostly good. Showers and storms are reported and conditions are said to have improved in almost the entire state. Ideas are that the better precipitation will help trees fight the greening disease. Temperatures are warm in the state, but the precipitation is the key right now. The tropics appear quiet and there are no storms in view. Brazil is seeing near to above normal temperatures and mostly dry weather, and there are reports of stress to trees and the potential for lower production. It could turn cold in some production areas early next week.

Overnight News: Florida weather forecasts call for showers. Temperatures will average near normal.

Chart Trends: Trends in FCOJ are up with objectives of 145.00 and 155.00 September. Support is at 140.00, 136.50, and 134.00 September, with resistance at 145.00, 147.00, and 149.00 September.

COFFEE (NYBOT:KCU13)

General Comments: Futures were higher in New York on speculative buying tied to some forecasts for colder and wetter conditions for Brazil Coffee areas starting this weekend. No forecast is calling for damaging temperatures, but the market is short. In addition, the rain could disturb the last of the harvest and it could get cold enough to freeze in Parana, which is nota ll that far away from Coffee producing areas. Chart trends are up in all three markets. London moved higher on some buying tied to fewer offers from Vietnam on ideas that producers there are about sold out. Exports in June as reported by the customs bureau there were less than expectations. Offers of Arabica from origin are still hard to find and feature strong differentials. Demand is improving as roasters sense the change in market direction. Brazil weather is forecast to show dry conditions, but no cold weather for the rest of the week. It could turn wetter and colder this weekend. Current crop development is still good this year. Central America crops are seeing moderate to light rains. Colombia is still reported to have good conditions.

Overnight News: Certified stocks are marginally lower today and are about 2.748 million bags. The ICO composite price is now 123.00 ct/lb. Brazil should get dry weather except for some showers in the south. Temperatures will average near to above normal, but below normal next week with frosts and perhaps a freeze possible in southern areas. Colombia should get scattered showers, and Central America and Mexico should get showers, and rains. Temperatures should average near to above normal.

Chart Trends: Trends in New York are up with objectives of 132.00 and 140.00 September. Support is at 125.00, 124.00, and 120.00 September, and resistance is at 129.00, 132.00, and 135.00 September. Trends in London are up with objectives of 1980 September. Support is at 1900, 1850, and 1820 September, and resistance is at 1980, 1995, and 2010 September. Trends in Sao Paulo are up with objectives of 156.00 and 164.00 September. Support is at 146.00, 143.00, and 140.00 September, and resistance is at 151.00, 155.00, and 159.00 September.

SUGAR (NYBOT:SBV13)

General Comments: Futures closed mixed in consolidation trading. There is not much new to talk about here so far this week. Futures trends remain down overall and price action has been weak as most expect a big production surplus for the year. Many expect production to be higher overall in Brazil due to a record Sugarcane production, and countries like Thailand and India also expect more production this year. The Indian monsoon is good so far this season and this should help with Sugarcane production in the country. Northern areas are in good shape, but southern areas might be too hot and dry and some stress to the Sugarcane is likely. Less production of Sugar beets is reported from Russia and Ukraine as farmers there elected to plant more grains.

Overnight News: Brazil should be mostly dry and warm this week, but could see colder and wetter weather this weekend.

Chart Trends: Trends in New York are mixed to down with objectives of 1580 October. Support is at 1570, 1540, and 1510 October, and resistance is at 1620, 1630, and 1650 October. Trends in London are down with objectives of 448.00 October. Support is at 457.00, 454.00, and 451.00 October, and resistance is at 465.00, 466.00, and 470.00 October.

COCOA  (NYBOT:CCU13)

General Comments: Futures closed higher on speculative buying tied to ideas that the North American grind data could be very strong. The US data should be out today. Ghana and Nigeria would appear to have the most problems with the rains, and it remains a little too dry in many parts of Ivory Coast. The weather is better in West Africa, with more moderate temperatures and some rains. A few showers are appearing again in Ivory Coast this week, but Ivory Coast will still need more rain. Other West African countries are reported to have good conditions. Malaysia and Indonesia crops appear to be in good condition and weather is called favorable.

Overnight News: Scattered showers are expected in West Africa. Temperatures will average near to above normal. Malaysia and Indonesia should see episodes of isolated showers. Temperatures should average near normal. Brazil will get mostly dry conditions and warm temperatures. ICE certified stocks are slightly lower today at 4.803 million bags.

Chart Trends: Trends in New York are up with no objectives. Support is at 2250, 2240, and 2210 September, with resistance at 2330, 2350, and 2380 September. Trends in London are up with objectives of 1640 September. Support is at 1560, 1550, and 1530 September, with resistance at 1610, 1640, and 1660 September.

See the original article >>
Options Trading - Using a Risk Reversal on Apple

by Reggie Middleton

This is a guest post from Marcus Holland. I don't endorse nor necessarily agree with the opinion and research expressed herein, and it is supplied as an OpEd piece only.

_______________________________________

Apple Stock (NYSE:AAPL) is trading slightly lower despite news that the company colluded with five major U.S. publishers to drive up the prices of e-books in the months ahead of the technology company entering the market in 2010.  Option volatility in the wake of this news, has declined slightly and sentiment surrounding the company has remained strong.

In a civil antitrust lawsuit, the Department of Justice claimed that Apple agreed with the 5 publishers in January 2010 to allow them to increase prices for best sellers and new releases in response to publisher Amazon.com $9.99 price point for those books on Amazon.com Inc.

The judge will likely schedule a hearing on a request by the Justice Department for injunctive relief, which could include requirements that Apple not enter into another agency agreement to sell e-books for a two-year period.

aapl stock rangeaapl stock range

Despite the blow to Apple the stock technically remains sound after recently testing support near 390 per share.  Resistance on the stock is seen near the 50-day moving average near 433.  Momentum on the stock is gaining traction as the MACD has recently generated a buy signal.  This occurs when the spread (the 12-day moving average minus the 26-day moving average) crosses above the 9-day moving average of the spread.  The RSI (relative strength index) is printing in the middle of the neutral range near 50, well below the overbought levels of 70 and and above the oversold levels of 30.

aapl stock volatilityaapl stock volatility

Implied volatility on AAPL edged higher, prior to the release of the decision and ahead of earnings in the coming weeks.  The recent lows near 25% represent an excellent opportunity to purchase volatility, while levels near 45% reflect a robust place to sell volatility.  At the current levels near 30%, options traders who are bullish on the stock could use a risk reversal and use the skew on the puts to benefit from the structure.  The structure mitigates the effect of implied volatility on a directional play.

In a risk reversal the investor will purchase a call and use the proceeds of a sold put to finance the trade.  A trade that would allow an investor to earn theta is an August 450-390 risk reversal in which the investor collect 10s cents by purchasing the 450 call for $5.20 and selling the 390 put for $5.30.  By using recent support at $390, and investor has a good spot to purchase the stock if Apple’s stock turns lower.

Comments from Reggie on the fundamental side...

The Apple Profit Engine Has Stalled & Is Rolling Downhill

Apple is facing a shart decline in the margins of its top two value drivers. May I also add that these two value drivers are 83% of Apple's revenues and an even greater portion of its profits. Such a drastic concentration in only two products who have reached their zenith is not a good thing!

Click the graphic once to view, twice to enlarge to printer quality...

Reggie Middletonss Ultimate Apple Value InfographicReggie Middletonss Ultimate Apple Value Infographic

Apple's Competition Is The Greatest It Has EVER Been!

Apple's competition is the greatest it has ever been, and features companies who are literally at the top of their game. We are talking a lot of companies, and at the top of a very difficiult game as well. Reference What Sell Side Wall Street Doesn't Understand About Apple - It's Not The Leader Of The Post PC World!!!

Apple is Materially & Quickly Losing Global Market Share! Clear Indicators Of Permanent Downward Moves In Its Peer Group

Apple is rapidly losing global market share over and the trend is worsening. This has ALWAYS signaled the beginning of the end for its peers. Reference Is Tim Cook Cooked? Market Share vs Profit Margin, part 2 - Follow What I Do, Not What I Say!

For those who don't subscribe and/or haven't already seen it, here is the video that tells (nearly) all about Apple, from beginning (Q3 2010) to end.

Of course, there is a point at which Apple is a good buy. After all, they have a lot going for them. The question du jour is, exactly what is that point? I refer my subscribers to the research documents below for the answers...

See the original article >>

Follow Us