by Jim Welsh
Forward Markets: Macro Strategy Review
Macro Factors and Their Impact on Monetary Policy,
The Economy and Financial Markets
U.S. Economy
Although corporate earnings were decent in the first quarter, they could be vulnerable if revenue doesn’t pick up in coming quarters. According to Global Equity Analytics & Research Service, sales growth fell for two-thirds of the companies in the Dow Jones U.S. Total Stock Market Index in the first quarter. The index includes every U.S. stock traded in the U.S., excluding bulletin board stocks. As such it includes more companies than any other index. Capital weighted average sales growth for the companies in the index fell for a fifth straight quarter to 3.1%. The last time sales growth was this weak was during 2001-2002, which was not a good time for equities. Average net profit margins fell to 24.3%, their steepest decline in 20 years. Profit margins are falling due to rising inventories and receivables, while selling, general and administration costs have begun to rise after companies had cut them to the bare minimum during the recovery. This suggests any further slowing in sales growth will immediately hit a company’s bottom line. Earnings in the first quarter were aided by a special factor: corporate stock buybacks. Corporations purchased $345 billion of their own company stock, which reduced shares outstanding at an annual rate of 8% through May, and contributed more than 30% to first quarter earnings. Boosting earnings through stock buybacks may look good in the short run (and increase the value of executives’ stock options), but the strategy seems to be lacking in the longer-term vision and commitment most companies need to innovate and prosper in the future.
In April and May, good and bad news alike were treated as good news by investors since the Federal Reserve was likely to maintain the third round of quantitative easing, or QE3. This one-way psychology was reflected in surveys of investor sentiment. We cited the Barron’s Big Money Poll in our April commentary, which found that 74% of responding money managers described themselves as bullish or very bullish for the balance of 2013. This was the highest level of bullishness in the 20-year history of the Big Money Poll. Incredibly, 86% were optimistic for the next 12 months, and 94% thought the next five years would be good. In our April commentary we thought the bullish psychology surrounding QE3 could lead to a blow off in the stock market that might carry the S&P 500 Index to between 1680 and 1700. The high on May 22 was 1687.
The bullish psychology generated by QE3 was also manifested in other markets. Leveraged loans are used by heavily indebted companies to finance growth, acquisitions and capital investments. Banks underwrite the loans, but distribute most of the debt to investors, including high yield bond funds. As demand increased in 2012 from investors looking for higher yielding alternatives to government bonds or certificates of deposit, Wall Street distributed $465 billion in leveraged loans, not much below the all-time record of $535 billion in 2007. According to data provider S&P Capital IQ, Wall Street sold $78 billion in leveraged loans in February 2013, eclipsing the prior record of $71 billion in February 2007. In addition, the quality of the loans deteriorated. The average borrower of leveraged loans carried a debt load of 4.8 times earnings, near the average ratio in 2007, and up from 4.3 last year. More than half of the loans sold in the first quarter didn’t include basic investor protections, compared to a peak of 25% in 2007. Who says history doesn’t repeat itself?
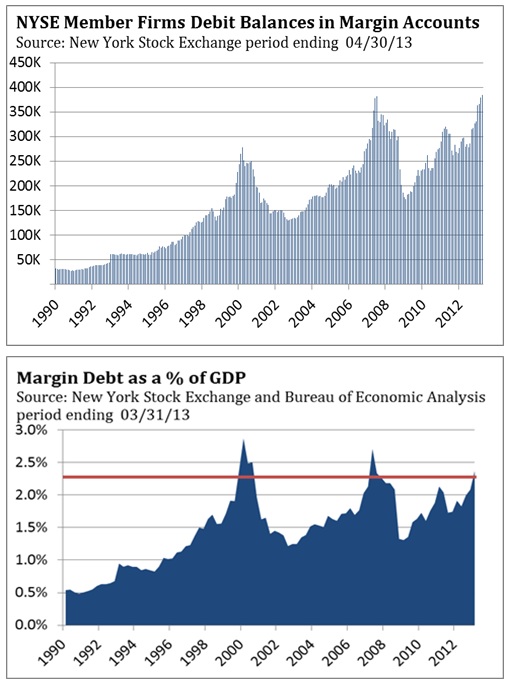
Despite the record supply of leveraged loans of ever-decreasing quality, demand was nearly insatiable. On May 8, the yield on the Barclays U.S. Corporate High Yield Bond Index fell to a record low of 4.97%. With the stock market scaling new heights, stock investors decided it was time to leverage their equity investments. In April, margin debt rose to a record $384 billion, surpassing the prior peak of $381 billion achieved in 2007, according to the Financial Industry Regulatory Authority. Margin debt has only exceeded 2.25% of gross domestic product (GDP) on three occasions: December 1999, March 2007 and January 2013. In 1999 and 2007, the stock market rallied for three to six months before topping, while the high in May this year was four months after margin debt reached 2.25% in January.
Since the beginning of 2013, the debate within the Federal Reserve about the benefits of QE3 and its negative unintended consequences intensified. Members of the Federal Open Market Committee (FOMC) have expressed concerns about its potential to spark inflation, create distortions in the credit market and increase risk-taking by investors reaching for yield. In recent months, a number of FOMC members have publically discussed the activity in the leveraged loan market, real estate investment trusts (REITs) and the overall reach for yield by investors into more risky investments. More evidence of this activity was seen in the issuance of leveraged closed-end fund structures and the increasing appetite of Japanese investors for levered U.S. REIT portfolios. We think the Federal Reserve concluded it was time for the markets to receive a sobriety checkup, which is why Chairman Ben Bernanke discussed the conditions under which the Federal Reserve would begin scaling back the amount of its QE3 purchases in his congressional testimony on May 22. Within minutes of Bernanke’s comments, the stock market reversed from all-time highs and the yield on the 10-year Treasury bond jumped above 2%. Investors were shocked that the free lunch quantitative easing has provided investors since 2009 might actually come to an end some day. When Chairman Bernanke reaffirmed the Fed’s commitment to “tapering” QE3 after the FOMC meeting on June 19, financial markets convulsed, sending stocks plunging and bond yields soaring.
Here’s our take on the situation. Given the current level of economic growth, unemployment rate and inflation, the Federal Reserve will not scale back their QE3 purchases next month. Any action will be dependent on incoming data and whether GDP growth, the unemployment rate and rate of inflation trend toward the Federal Reserve’s forecasts. The Fed expects GDP growth of 3-3.5% in 2014, the unemployment rate to fall from 7.5% to 6.5-6.7% and inflation to rise toward 2%. Our expectation is that QE3 may continue at its current level through 2013 since growth is unlikely to accelerate as forecast, muting the expected improvement in the unemployment rate. And weak global aggregate demand and excess capacity will keep inflation from rising as forecast. The sharp increase in mortgage rates only reinforces our view.
Since the recovery began in June 2009, the number of jobs has increased just 3.9%, versus the 9.7% average for all post-World War II recoveries. This is why 11.8 million people remain unemployed after four years of recovery.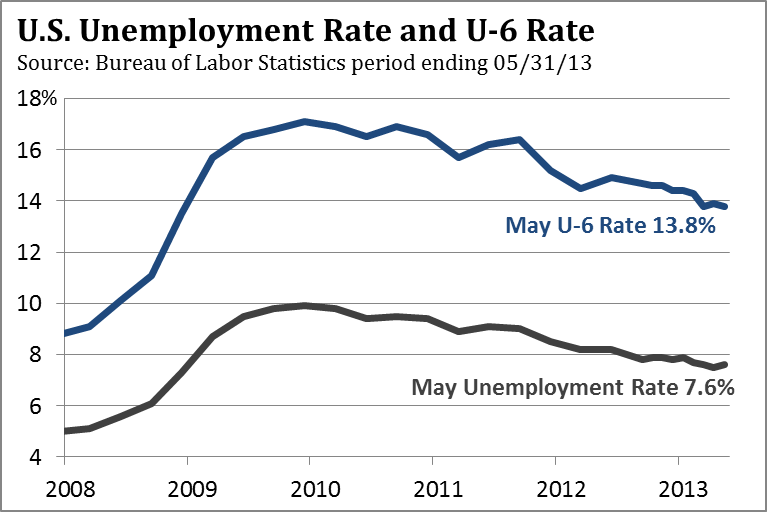 There are two million fewer people working now than in December 2007. The U.S. needs to generate 100,000 new jobs each month just to keep up with population growth and new entrants coming into the labor market. This means another 4.8 million jobs would have been needed over the past 48 months just to accommodate new workers. The true job shortfall in the number of jobs since 2007 isn’t two million jobs, but 6.8 million jobs. Since “real” job growth begins above 100,000 and not zero, actual job growth has been 72,000 per month over the last year, not the 172,000 as reported. This is one reason why the average jobless person remains out of work for 36.9 weeks. Annual growth in hourly pay for production workers and non-supervisors has been below 2% for 21 of the past 22 months. The earnings of the majority of those who are working are not keeping up with the increase in the cost of living. According to the Bureau of Economic Analysis, disposable personal income as of the end of March has climbed a total of 10.5% over the last five years. That is the smallest increase over any five-year period going back to 1959.
The Federal Reserve’s preferred measure of inflation is the core index of personal consumption expenditures (PCE), which excludes food and energy. The Fed would like to see the core PCE near 2%, but not above 2.5%. 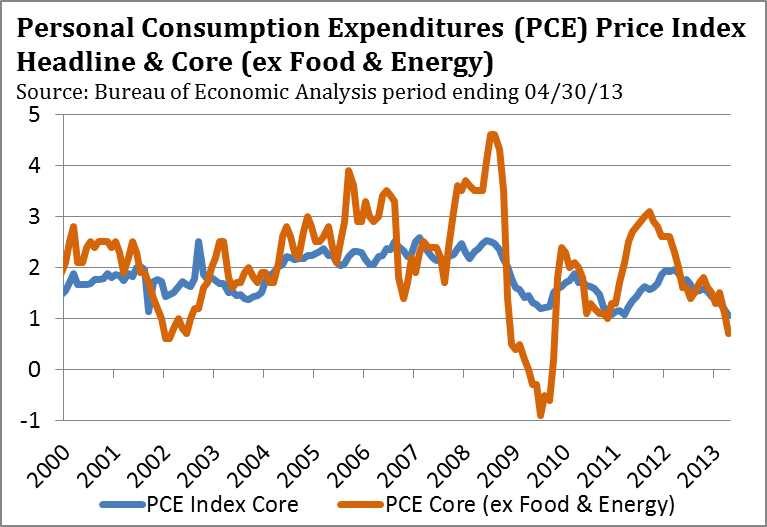 However, since early 2012, the core PCE has been trending lower, falling from just under 2% to 1.1% in May—one of the lowest readings in the index’s 54-year history. Inflation is the result of rising wages and too much money chasing too few goods and services. Neither is happening now and there is nothing on the horizon that suggests a pickup in inflation is right around the corner. Globally, there is an overcapacity of labor and production capacity. Between inflation and deflation, deflation is the greater risk.
China – An Echo Credit Bubble
In the United States between 1982 and 2007, total market credit as a percent of GDP grew from 165% to 350%. This means that for each $1.00 of GDP there was $3.50 of debt. The surge in debt during this 25-year period assisted economic growth and enabled GDP to grow faster than it would have without the extra boost from debt-fueled demand. The prime beneficiary of the increase in debt was home prices, which jumped from 3.2 times median income in 2000 to 4.7 times median income in 2007. The deflation of home values was the primary cause of the 2008 financial crisis, as leveraged bets on home prices blew up. More than 11 million homeowners were forced into foreclosure, as more than 8 million workers lost their job and others, still employed, were undone by ballooning mortgage payments. Investment banks were forced to seek a taxpayer bailout after the use of 30 to 1 leveraged dispelled any misguided notion they were “masters of the universe.” European bankers proved they were no smarter than their U.S. counterparts, and European consumers were just as gullible in their willingness to buy overpriced homes. In response to the financial crisis, the U.S. government and governments throughout Europe significantly increased government spending. The resulting large budget
deficits were used to replace the loss of consumer demand as unemployment soared in every developed nation and to prevent a far deeper recession from developing.
In 2009 China instituted a two-year, $586 billion stimulus program (equal to 16% of GDP). However, the Chinese government has in recent years relied more on forced lending through state-run banks to maintain growth to offset the impact of Europe’s recession and slow U.S. growth. According to McKinsey Global Institute, a global management consulting firm, China’s debt-to-GDP ratio rose to 183% in mid-2012 from 153% in 2008. However, if lending by trust companies and other sources in China’s “shadow banking” system is included, the debt-to-GDP ratio is above 200%, according to estimates by Nomura Holdings, a Japanese financial holding company. Total social financing, China’s broadest measure of credit since it includes bank lending and credit created outside formal banking channels (i.e. trust companies), increased an extraordinary 52% in the first five months of 2013 as compared to 2012. This suggests Nomura’s estimate is likely more accurate.
Compared to the United States’ total market credit ratio of 350%, and many European nations whose ratio of total debt-to-GDP exceed 400%, China appears a paragon of credit prudence. However, under the surface there are a number of cracks in China’s growth foundation that are concerning. According to the International Monetary Fund (IMF), rapid increases in a country’s total credit to GDP ratio can prove problematic. An IMF analysis of quick increases in credit growth over the last 40 years found that about one-third of the occurrences ended in a crisis, and subpar growth in subsequent years in another one-third of instances. China tried to slow credit growth in early 2010 and quarterly GDP growth weakened in 10 consecutive quarters through the third quarter of 2012. Credit growth resumed in April 2012 and continued through the first five months of 2013. Since economic activity lags changes in monetary policy by about six months, the recent surge in credit should continue to stabilize China’s GDP growth between 7 and 8% through the third quarter. The risks are to the downside since electricity output rose 4.1% in May versus 6.2% in April. Electricity output is a proxy for industrial activity and suggests recent GDP data may be overstating China’s actual growth.
In April and May, the People’s Bank of China (PBOC) moved to curb the explosion of credit growth that began in April 2012. In May, total social financing fell by one-third to $194 billion, after also declining in April. New bank lending, which is a subset of total social financing, also registered a significant decline. Despite the pullback in credit growth during the last two months, total social financing is still up 52% from May 2012. If the PBOC maintains its less accommodative stance in coming months, China’s economy will likely show signs of slowing sometime in the fourth quarter.
Since the 2008 financial crisis, the People’s Bank of China has alternated between stepping on the gas in 2009, hitting the brakes in early 2010, putting the pedal to the metal in April 2012 and in the last two months, at least tapping on the brakes. Despite this on and off approach, total debt as a percent of GDP continues to climb at a fairly rapid pace. It is not a good sign that the increase in lending since April 2012 is merely stabilizing growth, rather than generating a gain in the rate of GDP growth. In our view, this is a warning sign that China is progressively creating its own credit bubble. This was certainly the case in the U.S. when credit growth rose significantly during the 2004-2007 period without a commensurate jump in GDP.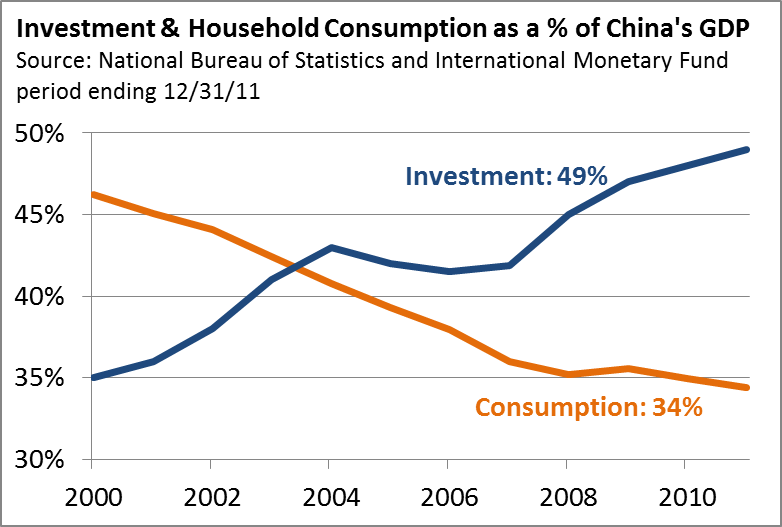
In the IMF analysis of prior rapid increases in a country’s total debt-to-GDP ratio, a growth slowdown occurred one-third of the time. China experienced this after they slowed credit growth in 2010. The risk that China could experience a more significant slowing or a credit crisis within the next three years is rising, especially since the imbalance between fixed investment and domestic consumption remains large. As we discussed in our November 2012 commentary, the surge in China’s growth from 2000 until 2008 was the result of a significant increase in fixed investment that expanded China’s infrastructure and export capacity. Cities for millions of inhabitants were built along with the power grid and power generation to keep these new cities humming. The expansion in export capacity allowed China to capitalize on its low cost of production, so it could increase its exports to Europe and the United States. As a result, fixed investment as a share of GDP rose from 34% in 2000 to 49% by the end of 2011, while domestic consumption contracted from 46% to 34%. By comparison, consumption in the U.S. is 70% of GDP, while fixed investment is 16.2%, according to the IMF.
We noted last November that it was likely to take China many years to correct its overreliance on fixed investment, and that the transition would be made more difficult by Europe’s recession and slow growth in the U.S. Europe is China’s biggest export market, with the U.S. a close second. The slowdown in export sales has created an excess capacity problem that is plaguing China’s export dependent sectors, while domestic demand has not increased sufficiently to offset the slowdown in exports. This is why GDP growth has not picked up and why the surge in lending this year is, in part, a reflection of China reverting to its old ways. According to the National Bureau of Statistics of China, fixed investment has only dipped from 49% to 46.1% since the end of 2012, while household consumption only experienced a modest increase from 34% to 35.7%.
According to a survey of 4,000 companies by the ManpowerGroup, a workforce solution provider, the net percentage of firms planning to hire workers in the second quarter fell to 12%,
from 18% in the first quarter. This is the lowest increase since the end of 2009. Year-over-year growth in disposable income for China’s urban households fell from 9.6% in 2012 to 6.7% in the first quarter. Weaker job and income growth suggest a meaningful pickup in domestic consumption is unlikely. Export growth was up only 1% in May from a year ago. We expect Europe to remain in recession for the balance of 2013, while growth in the U.S. holds near 2%. The recent decline in the value of the Japanese yen versus the Chinese yuan is also likely to further pressure China’s export competitiveness. A meaningful increase in exports during the balance of 2013 is not likely, nor is a big increase in domestic demand. This suggests that China will not add appreciably to global aggregate demand in the next two quarters.
In the last few years, the reliance on fixed investment to generate GDP growth has resulted in excess capacity in many industries, which is being exacerbated by slowing export growth and relatively tepid domestic demand. Before the 2008 credit crisis, steel, coal, glass, aluminum, cement and solar panels were all sectors that boomed, since these sectors provided everything needed to build out China’s infrastructure and export capacity. Mae West once said that, “Too much of a good thing can be wonderful.” That certainly is not the case in China as the amount of excess capacity in some industries is staggering. According to the National Bureau of Statistics of China, there are currently 3.7 billion square meters of property under construction in China, which is enough to satisfy demand for almost four years without starting a single new property. Steel production overcapacity is becoming a chronic problem. Domestic demand for steel was 684 million tons in 2012 compared to the production of 800 million tons, according to global investment banking firm Jeffries. Since there is more supply than demand, Chinese steel prices have fallen almost 15% in 2013. In a search for buyers, Chinese producers have been exporting some of their excess production to Europe, which has caused European steel prices to fall. Aluminum Corporation of China reported a $158 million loss in the first quarter and said more than 90% of the aluminum produced in China is produced at a loss. In early May, Huaxin Cement said cement makers need to shut down old plants to avoid “catastrophe” for the industry. According to the China Enterprise Confederation, a non-governmental representative of employers, the utilization rate for cement producers in 2012 was 65%.
 Firms with government connections are not likely to close excess capacity since they expect to get ongoing financial support. And this is what may prove to be China’s undoing. Chinese state-run banks have lent enormous sums to Chinese state-run companies who have continued to expand capacity, even if it means selling goods at a loss. Part of the 52% increase in total social financing through May was the result of Chinese state-run banks rolling over or extending
bank loans to state-run companies, even those companies running at 70-80% of capacity and barely profitable. Although China can easily continue this charade, international investors may not be so forgiving. At some point (perhaps 2014 or 2015) China could prove vulnerable to large capital outflows that will undermine its growth story and create liquidity problems for China’s state-run banking system. It could also potentially deflate the credit bubble that has been expanding in China since 2008.
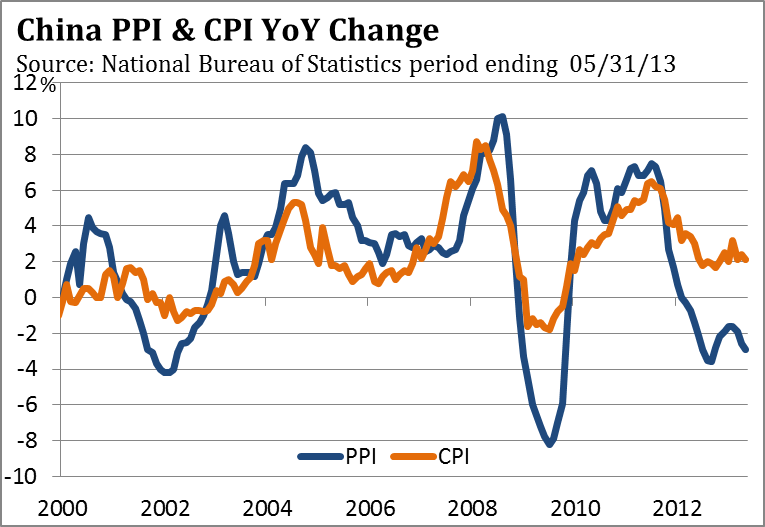
Falling prices as a result of excess capacity are reflected in China’s consumer price index, which has dropped from 6.5% in late 2011 to 2.1% in May. More importantly for Chinese companies, producer prices have declined year-over-year for 15 consecutive months and were -2.9% lower in May than in 2012. If the second largest and fastest growing economy on the planet is experiencing a whiff of deflation, what are the deflationary risks for developed countries with much slower growth and far more debt as a percent of GDP?
Japan — Winning in a Zero-Sum Growth World
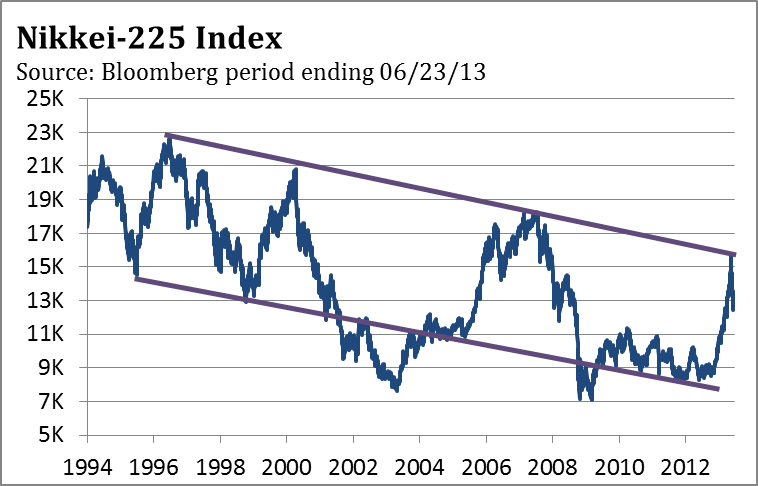
As we wrote in our February 2013 commentary, Japan’s effort to depress the yen’s value was not only risky but had the look of desperation after 20 years of monetary and fiscal policies failed to rejuvenate the Japanese economy. Since last November the yen has lost more than 20% of its value versus the dollar and is down more than 25% against the euro. As we pointed out, there isn’t much difference between a country that cheapens its currency by 20-25% and a country that slaps imports from competing countries with tariffs of 20-25%. This is 1930s protectionism masquerading as 21st century monetary experimentation pioneered by the Federal Reserve with quantitative easing. The Bank of Japan (BoJ) has no idea how this will eventually play out. The bank must be encouraged with the initial impact of “Abenomics,” so named after Prime Minister Shinzō Abe. In the first quarter, GDP surged 4.1%, powered by a pickup in domestic consumption and exports, which grew 10.1% in May from last year. Global equity investors have learned from the Federal Reserve and European Central Bank that quantitative easing is good for stocks. From a low below 8,700 last November, the Nikkei 225, a stock market index for the Tokyo Stock Exchange, soared to 15,760 on May 22, before dropping 20% by mid-June. Interestingly, the Nikkei reversed just below a trend line going back to 1996.
Amid all the hoopla surrounding the BoJ’s adoption of quantitative easing, global strategists have overlooked the potential negative fallout from the weaker yen. Global economic growth is not likely to increase materially over the next year. Gains in Japan’s GDP will come at the expense of other countries, which are heavily dependent on exports. Exports represent 56% of South Korea’s GDP, 50% of
Germany’s, 37% of Portugal’s, 31% of China’s, 30% of Spain’s, 29% of Italy’s, 27% of France’s and 14% of the United States’ GDP. Given the concentration of export dependence in the European Union, the 25% increase in the euro versus the yen represents another hurdle for Europe as it deals with its recession. Global investors responded to the adrenaline rush from the BoJ’s move to implement quantitative easing. However, the drag from the yen’s depreciation is likely to take six to nine months to ripple through the global economy. In a zero-sum global growth world, Japan’s gain will come at the expense of other nations.
Eurozone
According to Eurostat, the unemployment rate in the 17-nation eurozone rose to 12.2% in April, the highest since records began in 1995. Car sales fell again in May to the lowest level in 20 years, as reported by the European Automobile Manufacturers’ Association. Bank lending continues to contract so any turnaround is still months away. Contrary to most strategists, we expected the eurozone to remain in recession during 2012, and for the recession to continue at least in the first half of 2013. The good news is that the recession is likely to bottom in the last half of 2013. The bad news is that meaningful growth is unlikely anytime soon. The eurozone may not be the drag it has been on global growth since late 2011, but it isn’t going to add much to global aggregate demand in the second half of 2013. 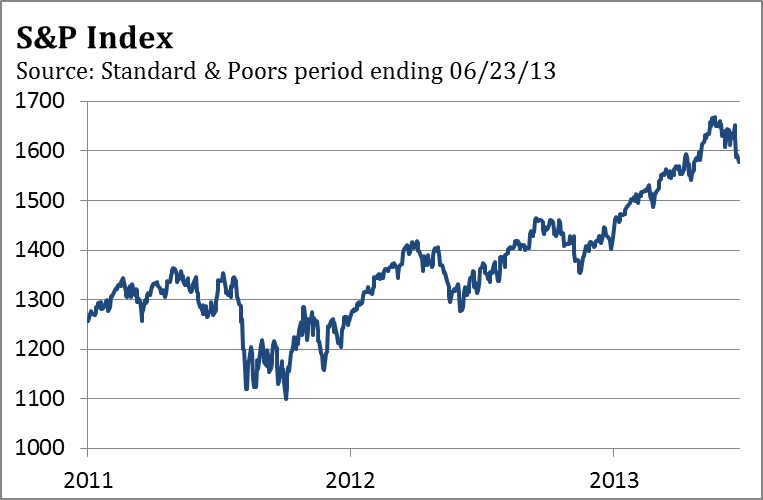
Stocks
When the S&P 500 Index reversed on May 22, every major market average had just made a new all-time high, as did the advance/decline line, along with 925 stocks that established a new 52-week high during the week of May 20. Normally, market prices peak after peak momentum, so it is would be unusual for market prices to top out coincidently with such strong upside momentum. Last month we thought the S&P 500 was likely to retest the break out level of 1,600 at a minimum, which it has done. The initial decline was 89 S&P 500 points to 1,598. After rallying to 1,654, an equal decline of 89 points targeted the index at 1,565, which is just below the 2007 peak of 1,575. Since the March 2009 low, the S&P 500 has marched higher to new highs, with each intermediate low higher than the previous low. This is the classic definition of an uptrend. As long as the S&P 500 does not breach the April 18 low of 1,536, the long-term trend remains up.
Markets don’t top because there are too many bulls. Markets top when investors are given a reason to sell and doubts about QE3 provided a reason. If the economy fails to validate the Federal Reserve’s forecasts, as we expect, investors will realize their expectations that QE3 will be ending soon are unfounded. That could provide the story that supports another rally and tests the May peak.
Treasury Bonds
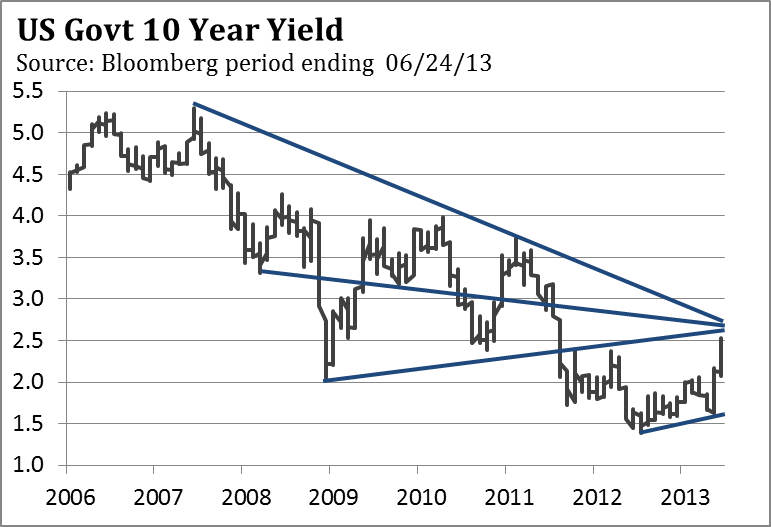 The yield on the 10-year Treasury bond has risen above the peak of 2.4% during March 2012, which is a negative for the long-term trend and lowers the probability that the 10-year yield might challenge the all-time low of 1.39% reached in July 2012. There are a number of trend lines that converge in the area of 2.55% and 2.70%. The initial increase from the July 2012 low of 1.38% was 0.70%, bringing it up to 2.08%. If the current move is a “Fibonacci number”—1.618 times that 0.70% rise—the yield would reach 2.74% (May 3, 2013 low of 1.61% + 1.13%). Technically, the 10-year Treasury bond is approaching an area that could provide intermediate support. If the economy fails to validate the Federal Reserve’s forecasts, as we expect, Treasury bonds could enjoy a nice rally in coming months, especially since bearish sentiment is reaching an extreme.
See the original article >>


