Monday, July 18, 2011

SPY Trends and Influencers


Last week’s review of the macro market indicators looked for Gold ($GLD) and Crude Oil ($USO) to both continue higher. The US Dollar Index ($UUP) and US Treasuries ($TLT) to move higher towards resistance at 77.30 and 97.30 respectively. The Shanghai Composite ($SSEC) and Emerging Markets ($EEM) also were biased to the upside, although both have resistance nearby. Volatility ($VIX) looked to remain stable and subdued allowing for the Equity Index ETF’s $SPY, $IWM and $QQQ to continue higher. But each are showing signs of a pullback in the short timeframe that could translate into the weekly timeframe quickly, with Treasuries moving higher as a possible catalyst. Look for upside but keep the stops tight. A reversal could come quickly. 

Gold did move higher through the week but with Crude Oil consolidating, ending only slightly higher. The US Dollar Index finished slightly higher after some volatile days and Treasuries rose but gave some back. The Shanghai Composite moved higher while Emerging Markets fell off. Volatility drifted higher but was still contained, as the Equity Indexes drifted lower. What does this mean for the coming week? Let’s look at some charts. 

As always you can see details of individual charts and more on my StockTwits feed and on chartly.)
Gold Weekly, $GC_F
gold w2 stocks
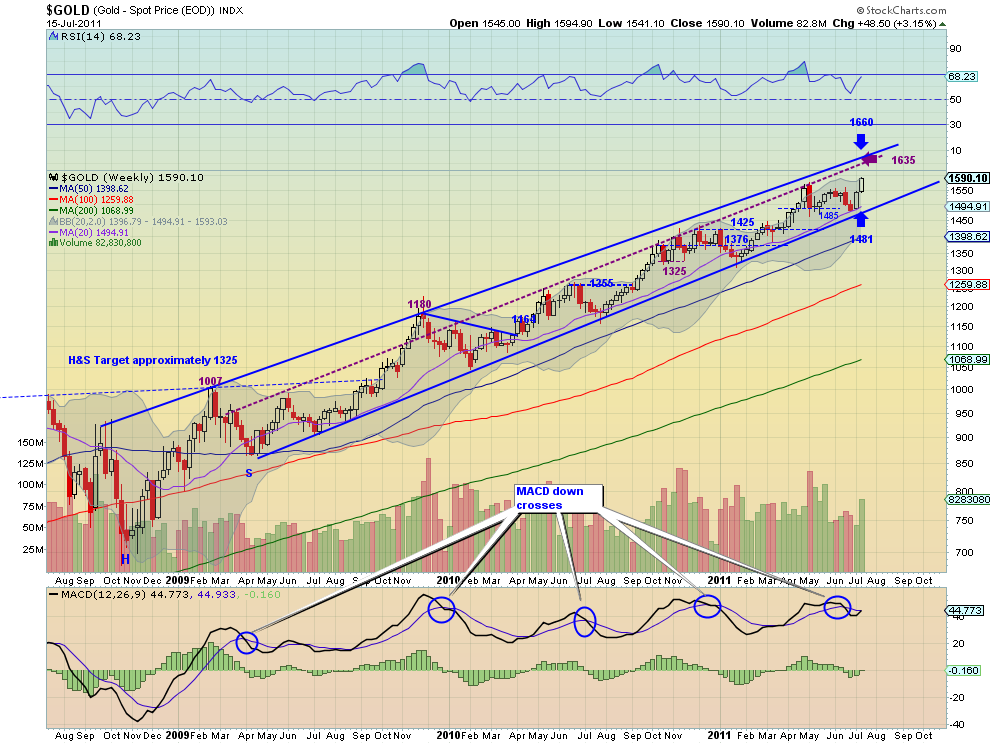
Gold continued its run higher extending the streak to nine days and end near the 1600 level. The daily chart shows it breaking out of a range between 1475 and 1560 leading to a target on a measured move to the 1645-1665 area. The Relative Strength Index (RSI) is hugging the 70 level but not extended and the Moving Average Convergence Divergence (MACD) indicator is rising, both supporting more upside. The weekly chart shows too strong candles with a rising RSI and MACD crossing positive. A third long white candle would create a very bullish Three Advancing White Soldiers Pattern. There is room to the upper rail at 1660 within the up channel. Look for more upside next week and a possible test of the intermediate trend at 1635. Any pullback should find support at the 1550-1560 area.

SPY Daily, $SPY
spy2 e1310769029932 stocks
SPY Weekly, $SPY
spy w3 e1310769066416 stocks
The SPY moved lower testing the support of the rail of the previous expanding wedge and the long term support/resistance at 131.46. The daily chart shows the RSI hitting the mid line, finding support and moving sideways but the MACD is approaching a cross negative. All of the SMA’s are converging. The weekly chart shows the range between 126 and 136 in tact with the RSI moving lower again but the MACD improving. Look for the coming week to be biased to the downside but with support at 131.46 and 130 below before the bottom of the range. Any move to the upside needs to clear 135.90 and 136.50 to change from consolidation to uptrend.

Next week then looks for Gold to continue its run higher and for Crude Oil to continue to consolidate with a bias for any breakout to the upside. The US Dollar Index looks ready to move higher but could consolidate further, while US Treasuries move sideways. The Shanghai Composite looks ready to break the flag higher while Emerging Markets consolidate in a broad range between 44.2 and 48.2. Volatility looks to remain subdued but despite this Equity Index ETF’s, SPY, IWM and QQQ look biased to the downside in their broad ranges, but near support. A true stock pickers market. Use this information to understand the major trend and how it may be influenced as you prepare for the coming week ahead. Trade’m well.

Wall Street Economists Have This Recovery All Wrong

By Barry Ritholtz

My Sunday Washington Post column is out, and its titled “Note to investors: It takes longer to bounce back from a credit crisis” The online version gets a different title, Wall Street analysts and economists have this recession recovery wrong.

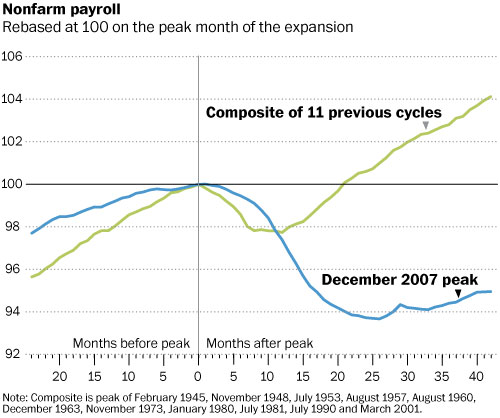
In it, I discuss how the post WW2 recession recovery cycle is the wrong frame of reference for looking at post credit crisis recoveries.


And while most Wall Street economists and analysts have gotten this entire cycle dead wrong, two academic economists standout as being prescient, before, during and after the crisis.

Here is a quick excerpt explaining how post credit cycles differ from ordinary recessions:
“Not only are credit crises different from other cycles, they also differ from other bubbles.
As Dan Gross explained in “Pop! Why Bubbles Are Great for the Economy,” the typical investing bubble leaves behind something of value. Whether it was thousands of miles of railroad tracks in the 19th century or thousands of miles of fiber-optic cables in the 1990s, usable infrastructure survives the bubble. Assets get scooped up out of bankruptcy for pennies on the dollar. Eventually, all of this overinvestment in the bubble du jour becomes a productive part of the economy. All that cable laid by Global Crossing and Metromedia Fiber and other bankrupt firms? Today, it is the bandwidth infrastructure that supports Google Maps, Netflix streaming video and Twitter.
Compare that with what gets left behind after a credit bubble bursts: No physical infrastructure, innovations or research breakthroughs; just soul-crushing, economy-sapping debt. And not just regular old balance-sheet obligations, but huge piles of counterproductive consumer and government liabilities.
Credit bubbles produce the exact opposite of productive resources. Deleveragers — those folks formerly known as consumers — spend the next decade paying down these obligations, rather than buying additional goods and services. And heavily indebted state and local governments are similarly thrifty, adding further pressure to the post-crisis economy.
Confusion about this is already taking a toll across the pond. The Irish, British and, soon, Greeks have bought into a misguided belief in austerity — that they can somehow cut their way to growth. In the United States, we have seen states and municipalities slashing head counts of teachers, cops and firemen. The “paradox of thrift” has morphed into a misguided economics of austerity. Hence, even when the private sector manages to create some jobs, its offset by public-sector job cuts.”
You can see the rest in either text or if you prefer PDF, click the image below:
click for PDF

>
Source:
Wall Street analysts and economists have this recession recovery wrong
Barry Ritholtz
Washington Post, July 17 2011
http://www.washingtonpost.com/business/wall-street-analysts-and-economists-have-this-recession-recovery-wrong/2011/07/14/gIQAVRTIGI_story.html

National Debt Ceiling Explained in One Graphic

By Barry Ritholtz

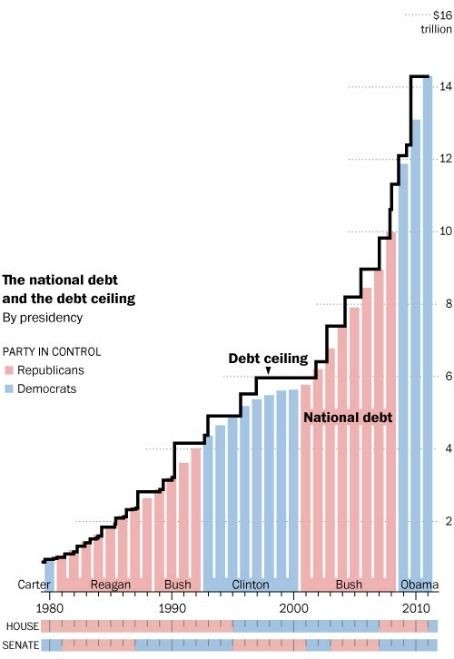
Ezra Klein explains thirty years of the debt ceiling in one graph (note the Congressional control appears to be backwards):
>


See the original article >>

FDIC Bank Failures

By Barry Ritholtz

Another weekend, a few more shut downs, via The Chart Store:


See the original article >>

S & P: America Could Default Even if Debt Ceiling is Raised

By Washingtons Blog

As I noted yesterday, America could default even if the debt ceiling is raised.
One of the big, government-sponsored American rating agencies has just confirmed my post.

Specifically, Standard & Poor’s announced today:
[We're putting U.S. debt on] CreditWatch with negative implications … owing to the dynamics of the political debate on the debt ceiling, there is at least a one-in-two likelihood that we could lower the long-term rating on the U.S. within the next 90 days ….
The political debate about the U.S.’ fiscal stance and the related issue of the U.S. government debt ceiling has, in our view, only become more entangled.
***
We may lower the long-term rating on the U.S. by one or more notches into the ‘AA’ category in the next three months, if we conclude that Congress and the Administration have not achieved a credible solution to the rising U.S. government debt burden and are not likely to achieve one in the foreseeable future.
The Washington Post adds:
S&P managing director John Chambers said in an interview … even if the parties agree to raise the debt ceiling, it may not be enough to avert a downgrade. Chambers said the country must implement a plan to reduce the annual budget deficit by roughly $4 trillion over 10 years, which makes the debt manageable over the long term.
The White House and Congress have discussed a plan that big, but negotiations have more recently centered on a smaller deal, at $2 trillion or less.
“That could still lead to a downgrade,” Chambers said.
Knee-jerk conservatives may say, “yes, we have to slash all social support programs like unemployment benefits and food stamps”.

Knee-jerk liberals might say “raise taxes instead of cutting any spending”.

And stopping bailouts and giveaways for the top .1% of the richest elite (which weaken rather than strengthen the economy, as shown here, here and here) and slashing spending on unnecessary imperial wars (which reduce rather than increase our national security, as demonstrated here and here) is what the budget really needs.
As I wrote last year:
Why aren’t our government “leaders” talking about slashing the military-industrial complex, which is ruining our economy with unnecessary imperial adventures?
And why aren’t any of our leaders talking about stopping the permanent bailouts for the financial giants who got us into this mess? And see this.
And why aren’t they taking away the power to create credit from the private banking giants – which is costing our economy trillions of dollars (and is leading to a decrease in loans to the little guy) – and give it back to the states?
If we did these things, we wouldn’t have to raise taxes or cut core services to the American people.
I pointed out the next month:
If there’s any shortfall, all we have to do is claw back the ill-gotten gains from the fraudsters working for the too big to fails whose unlawful actions got us into this mess in the first place. See this, this, this, this and this.

Commodities Turn the Corner

by Tom Aspray

Technical indicators suggest that the commodities correction may be over, and now is a good time to establish long positions in select broad-based or more specialized commodity ETFs.

Silver’s sharp reversal in May caused selling in many of the commodity markets, so it was not surprising that Barclay’s Capital estimated that $6.5 billion came out of the commodity markets in May. Further outflows in June means the rate of outflows is almost as much as what moved out of the commodity funds in late 2008.

Of course, this was at the height of the financial crisis. The open interest in many of the individual commodities has also dropped sharply, as fewer are willing to hold long positions. For example, the open interest in coffee and copper were both down over 70%.

On May 5, I suggested that “The Commodity Bull Market Isn’t Over.” At the time, my analysis suggested that “A deeper correction and a significant retracement of the recent gains should be an opportunity to establish either 1) long positions in a broad-based commodity vehicle, or 2) targeted positions in a specific commodity market.”

The commodity markets have firmed over the past two weeks, suggesting that the correction may be over. The added pressure on the US dollar over the widening concern over the debt ceiling is also a positive for the commodity markets, and so too are China’s recent growth numbers.
chart
Click to Enlarge

Chart Analysis: The Reuters CRB Index declined to just below the upper boundary of its weekly trading channel (line a) and the 620 level was briefly broken. The 38.2% support from last summer’s low is at 600 with the 50% level just under 570.
  • The current correction has not lasted quite as long as the one that occurred in early 2010 (see circle), but this one is taking a similar shape
  • There is key weekly resistance at 662.37, and a close above this level will indicate that the correction in commodities is over
  • Once above the previous high at 691, the next upside target is in the 712 area
Elements Rogers Total Return ETN (RJI) was designed to track the global consumption of a basket of 36 commodities. It has 35% in agricultural commodities, 21% in both precious and base metals, and the remaining 44% in energy.
  • RJI peaked on April 8 at $10.51 and dropped to a low of $8.91 on June 24
  • This drop slightly violated the 38.2% support at $9.05 with the 50% support at $8.60
  • Short-term support is now in the $9.25-$9.42 area
  • The daily on-balance volume (OBV) is now testing its declining weighted moving average (WMA) and the downtrend, line e. The weekly OBV (not shown) confirmed the April highs and has held above its rising weighted moving average on the correction
  • Next resistance is at $9.90 and a close above this level should complete the correction

chart
Click to Enlarge

PowerShares DB Commodity Index ETF (DBC) is more narrowly focused than RJI, as it includes the commodities like light sweet crude oil (West Texas Intermediate, or WTI), heating oil, RBOB* gasoline, natural gas, Brent crude, gold, silver, aluminum, zinc, copper grade A, corn, wheat, soybeans, and sugar.
*RBOB: Reformulated Blendstock for Oxygenate Blending. This is the benchmark gasoline product traded on the major commodity exchanges.
  • After peaking at $32.20, DBC dropped below first support (line a) at $28.27 before turning around. It came very close to the daily Starc-band, but held above the stronger support at $27.40, line b
  • The daily OBV held its uptrend, line d, on the recent correction and has moved back above its weighted moving average. It is acting stronger than prices and is very close to its prior highs, line c
  • Weekly OBV has held above its weighted moving average on the correction and could make new highs this week
  • The rally has taken DBC close to the latest high at $30.68 with the daily Starc+ band at $30.89
  • There is further resistance at $31.34 and then at $32.02. The 127.2% retracement resistance target is at $33.10
  • Short-term support is now in the $29.80-$30.20 area and then at $29.40
The Elements Rogers International Agricultural Total Return ETN (RJA) closed below the 38.2% support for two days in the latter part of June, hitting a low of $9.76 before rebounding sharply.
  • The daily downtrend (line e) is at $10.64 with further resistance in the $10.90-$11.10 area. Once above the early-2011 highs at $11.95, the 127.2% Fibonacci target is at $12.55.
  • The daily OBV has broken its steep downtrend, line f, as volume has increased on the rally. The weekly OBV (not shown) did confirm the recent highs but is well below its now- flat weighted moving average
  • There is short-term support now at $10.50 with further support in the $10-$10.20 area
What It Means: Though the agricultural sector is still lagging, the action in the broader commodity markets suggests the correction from the recent highs is likely over. One more pullback to the highs of a few weeks ago is possible, but I would not be surprised to see RJA and DBC at new highs by the end of the summer.

How to Profit: As recommended in May, buyers of the Elements Rogers Total Return ETN (RJI) should be 50% long at $9.24 and 50% long at $9.08 with a stop at $8.57. On a close above $10.05, raise the stop to $8.77.

The PowerShares DB Commodity Index ETF (DBC) missed my initial buying zone by just eight cents. I would now go 50% long at $30.06 and 50% long at $29.77 with a stop at $28.66 (risk of approx. 4.3%).

For the Elements Rogers International Agricultural Total Return ETN (RJA), buyers should be long 50% long at $9.96, although the second buying zone at $9.54 was missed. Use a stop now at $8.94.

In the May article, I recommended going50% long the United States Oil Fund (USO) at $38.66 and 50% long at $37.94. Both positions were stopped out at $36.89, resulting in an approximate 3.9% loss.

I also recommended a 50% long position in United States Natural Gas Fund (UNG) at $10.77 and a 50% long position at $10.44. Keep the stop at $9.89, as UNG closed Wednesday at $11.02.

Follow Us