by
Last week’s review of the macro market indicators looked for Gold ($GLD) and Crude Oil ($USO) to both continue higher. The US Dollar Index ($UUP) and US Treasuries ($TLT) to move higher towards resistance at 77.30 and 97.30 respectively. The Shanghai Composite ($SSEC) and Emerging Markets ($EEM) also were biased to the upside, although both have resistance nearby. Volatility ($VIX) looked to remain stable and subdued allowing for the Equity Index ETF’s $SPY, $IWM and $QQQ to continue higher. But each are showing signs of a pullback in the short timeframe that could translate into the weekly timeframe quickly, with Treasuries moving higher as a possible catalyst. Look for upside but keep the stops tight. A reversal could come quickly.
Gold did move higher through the week but with Crude Oil consolidating, ending only slightly higher. The US Dollar Index finished slightly higher after some volatile days and Treasuries rose but gave some back. The Shanghai Composite moved higher while Emerging Markets fell off. Volatility drifted higher but was still contained, as the Equity Indexes drifted lower. What does this mean for the coming week? Let’s look at some charts.
As always you can see details of individual charts and more on my StockTwits feed and on chartly.)

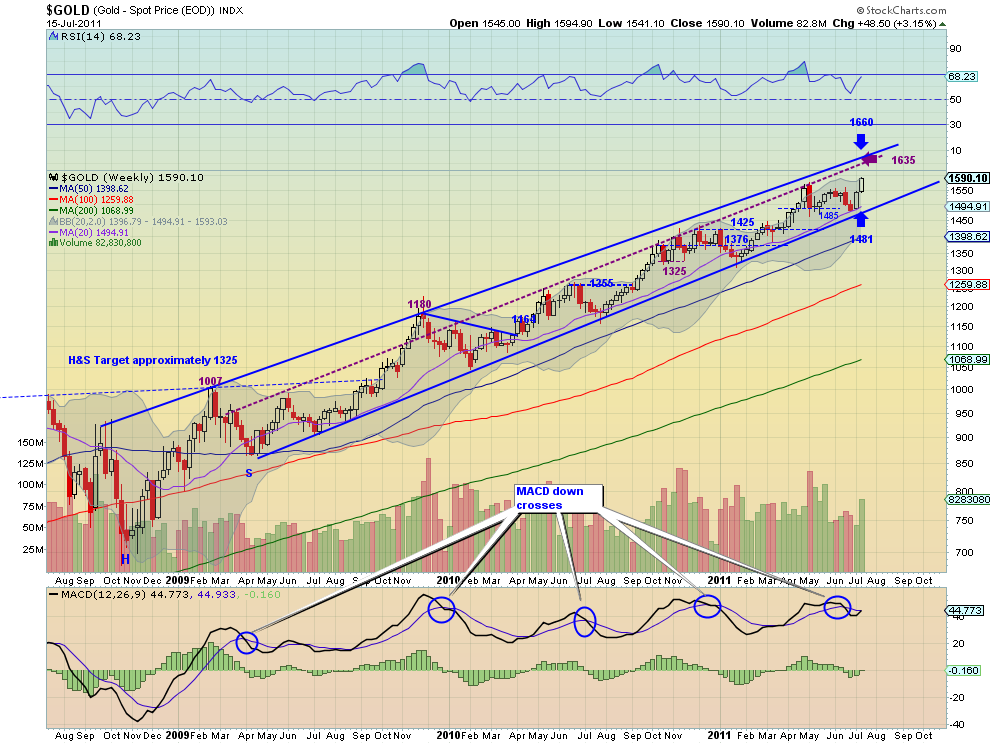
Gold continued its run higher extending the streak to nine days and end near the 1600 level. The daily chart shows it breaking out of a range between 1475 and 1560 leading to a target on a measured move to the 1645-1665 area. The Relative Strength Index (RSI) is hugging the 70 level but not extended and the Moving Average Convergence Divergence (MACD) indicator is rising, both supporting more upside. The weekly chart shows too strong candles with a rising RSI and MACD crossing positive. A third long white candle would create a very bullish Three Advancing White Soldiers Pattern. There is room to the upper rail at 1660 within the up channel. Look for more upside next week and a possible test of the intermediate trend at 1635. Any pullback should find support at the 1550-1560 area.

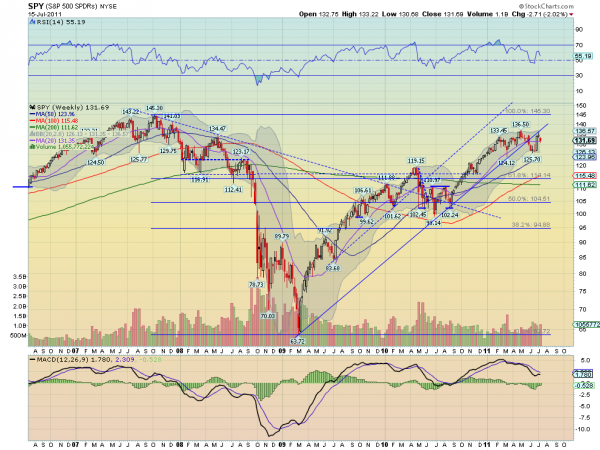
SPY Weekly, $SPY

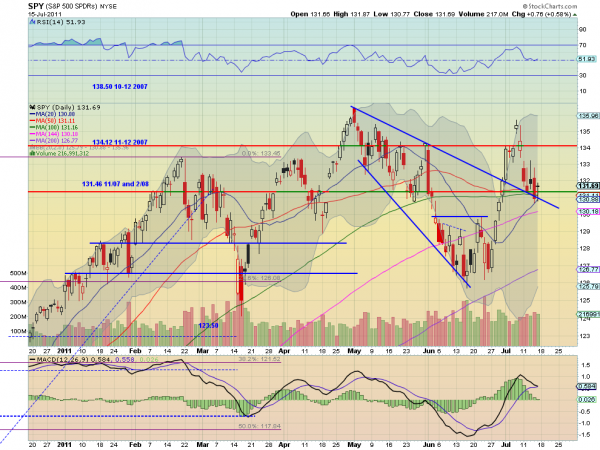
The SPY moved lower testing the support of the rail of the previous expanding wedge and the long term support/resistance at 131.46. The daily chart shows the RSI hitting the mid line, finding support and moving sideways but the MACD is approaching a cross negative. All of the SMA’s are converging. The weekly chart shows the range between 126 and 136 in tact with the RSI moving lower again but the MACD improving. Look for the coming week to be biased to the downside but with support at 131.46 and 130 below before the bottom of the range. Any move to the upside needs to clear 135.90 and 136.50 to change from consolidation to uptrend.
Next week then looks for Gold to continue its run higher and for Crude Oil to continue to consolidate with a bias for any breakout to the upside. The US Dollar Index looks ready to move higher but could consolidate further, while US Treasuries move sideways. The Shanghai Composite looks ready to break the flag higher while Emerging Markets consolidate in a broad range between 44.2 and 48.2. Volatility looks to remain subdued but despite this Equity Index ETF’s, SPY, IWM and QQQ look biased to the downside in their broad ranges, but near support. A true stock pickers market. Use this information to understand the major trend and how it may be influenced as you prepare for the coming week ahead. Trade’m well.
No comments:
Post a Comment