Saturday, May 14, 2011

SILVER’S BUBBLE AND VOLATILITY

By Charles Rotblut

The recent plunge in silver prices provides lessons for all investors, regardless of whether you invest in commodities or not.

As I started writing this on Thursday morning, iShares Silver Trust ETF (SLV) was down by 5.7%. Though significant by itself, the decline was just the latest in what has been a very bad month for SLV shareholders. Since the start of May, the ETF has fallen from $46.88 to this morning’s $32.42, a drop of nearly 31%. The drop is even worse when you consider that SLV hit an intraday high of $48.35 on April 28.
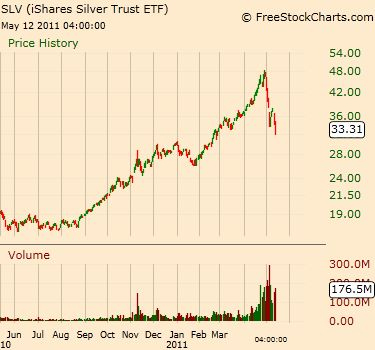
Notice the volume bars at the bottom of the chart. Interest in the ETF has surged over the past six weeks. Any time a security jumps in price on high volume without a fundamental basis for doing so, trading becomes nothing more than a game of hot potato. Anyone who is simply trying to get in on the price action is banking on the greater fool theory–the hope that someone will pay an even higher price for the asset. Historical records going back to at least the 17th century Dutch tulip bulb bubble show the fallacy of such a strategy.

To be fair, the rally in silver was started in large part by the combination of the weaker U.S. dollar and fears about future inflation. As these concerns pushed gold prices higher, silver prices rose too. The theory is that a comparable valuation exists between gold and silver. The problem with this line of thinking is that over time the ratio of gold to silver prices has varied. The variance in comparative values between the two metals makes it difficult to pinpoint a magic ratio that suggests one metal is cheap or expensive relative to the other. Furthermore, when people have economic fears, they reach for gold; when people fear werewolves, they reach for silver.

Silver does have more industrial uses than gold, which mostly just sits there and glitters. The rise in silver prices was in no way justified by increased demand, however; a simple look at the economic data shows that. Rather higher gold prices and speculation accounted for the overwhelming majority of the gains in silver.

This brings me to an important point: If determining a valuation is difficult and price movement can’t be tied to changes in demand, then figuring out when to buy and sell becomes nothing more than a guess. The reason I don’t own SLV, or SPDR Gold Shares (GLD), is that I have problems valuing something with no cash flow associated with it. It’s always safer not to invest in something you can’t value, rather than guessing when to get in and out.

Precious metals do have a role as a hedge against currency devaluation. They have stored worth and tend to be uncorrelated with stocks over long periods of time. A broad basket of commodities may actually work even better for diversification purposes (I personally hold a small position in a commodity exchange-traded note (ETN)), though I cannot emphasis enough the importance of having a thorough understanding of what you are investing in.

Finally, if you do use price momentum to gauge when to buy into and sell out of a security, consider the fact that many other people are looking at the same charts as you are. So take the extra step and carefully evaluate the fundamentals. A security with a fundamental reason to appreciate (valuation, rising earnings, strong financials, etc.) is less risky than one that lacks a fundamental reason to rise.

DOLLAR WEIGHTED VOLUME INDEX

By Carl Swenlin

Recently I found something interesting regarding our volume indicators. First, we have been observing that the Advance-Decline Volume Line has not confirmed the new price highs for many months (see chart below), and this condition has been reflected in all indicators that use A-D Volume numbers. This indicator is calculated daily by subtracting the volume of declining stocks and adding the volume volume of advancing stocks to a cumulative total. The problem with this indicator is that low-priced, high-volume stocks can have undue influence on the volume trend.
Chart
This week I realized that our Dollar-Weighted Volume (DWV) index was a better indicator for comparing price to volume, and confirming new price highs. It is calculated similarly to A-D Volume, but, additionally, volume for each stock is multiplied by the stock price, and that result is used for the cumulative total. The result is that we can see if net dollars are going into advancing or declining stocks. As you can see this version of volume analysis confirms the rising price trend of the bull market that began in 2009, as well as the series of new highs from the 2010 low to the present.
Chart
Another prominent feature on this chart is the obvious positive divergence that occurred at the bear market low in March 2010. At the time it would have been a strong sign that the bear market was over.

We have been collecting data for this indicator for years, but I have found it to be extremely boring because it usually tracks price movement so closely. As it turns out, that is a good thing, because it is a reliable confirming indicator. On the rare occasions when it doesn’t confirm price movement, it is even more valuable.

While DWV appears to be a useful tool in the short- and medium-term, in the longer-term the chart below shows that it has an upward bias and is of no use in that time frame. This upward bias is caused by the fact that prices during declines, obviously, keep getting lower and lower, so the price multiplier generates a smaller result, unless volume increases proportionately, which apparently it doesn’t. If I recall correctly, in general bear market volume tends to be lower than bull market volume.
Chart
The Nasdaq 100 chart of DWV profoundly emphasizes the long-term upward bias of DWV.
Chart
Bottom Line: The Dollar-Weighted Volume indicator is a valuable tool for confirming price performance in the short- and medium-term, and it is clearly superior to the traditional Advance-Decline Volume Line. It’s long-term upward bias makes it of no value in that time frame.
As far as I know, this indicator is exclusive to DecisionPoint.com.

ALL CASH BUYERS PREVENT HOUSING MARKET COLLAPSE

By Keith Jurow

I’ve asserted in previous writings that buyers paying all-cash for properties have been keeping some of the worst bubble markets from collapsing. Inside Mortgage Finance, which surveys roughly 3,000 brokers each month and issues a monthly report, revealed at the end of March that a record 33.7% of property purchases nationwide were all-cash.

The National Association of Realtors (NAR) conducts an Investment and Vacation Home Buyers Survey annually. The latest survey covering 2010 found that a record 59% of investors paid all-cash for their property. That figure was only 32% in 2006 and a mere 17% in 2004 according to previous NAR surveys.
For Broward County on the Florida east coast, the Southeast Florida MLS reported that a record 69% of all February property sales were all-cash purchases. Zillow.com revealed at the end of February that 54% of all sales in the three south Florida counties of Dade, Broward, and Palm Beach were purchased with cash in the fourth quarter of 2010. In California, 30% of all 2010 sales were cash purchases. According to the highly-regarded California blog, drhousingbubble.com, the average in that state over the last 10 years was a mere 12.9%.

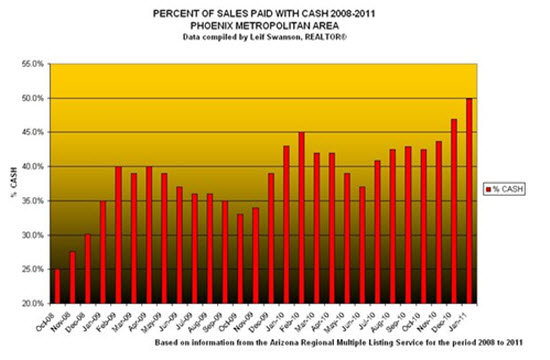
Take a look at this amazing chart showing cash sales in Phoenix.
Notice that while cash purchases have been a substantial portion of Phoenix sales since early 2009, it reached a record 50% in January of this year.

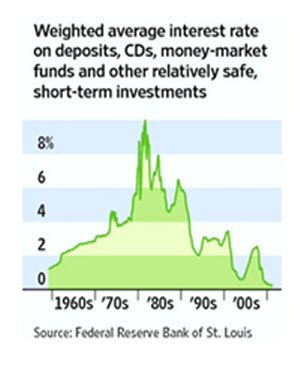
Who are these all-cash buyers? Leif Swanson, the creator of this chart and an active Phoenix broker, explained to me that many were over 50 with plenty of liquid assets who could not stand the interest rates they were getting. This was also told to me by Jim McClelland, Sr., a major property “redeveloper” in Chicago who resold many of his foreclosure purchases to all-cash investors. Most were cash buyers who were 50+ years old and were tired of earning interest rates of 1% or less.

Can you blame these 50+ savers, especially those nearing retirement? Take at look at what has happened to their interest income because of the Fed’s policies.
A substantial number of these savers are what I consider to be reluctant real estate investors. They are being pulled into this arena by the plunge in their interest return. I strongly suspect that many have little sense of how much risk they are taking with their capital.

Consider this example from a March 1 article in the online Palm Beach Post about all-cash investors. One retired couple decided to buy a three-bedroom home for $149,000 in cash because they believed a home would bring a better return on their money than a CD or other investment. The wife said that “any kind of interest income is so low right now, we might as well put it into a house.” She went on to predict that “If prices go down any more, they’re not likely to go down appreciably.” Had she read the second issue of my Housing Market Report and its focus on Miami-Dade County, they might have reconsidered their decision to buy.

Or take this example from an early February article in the Wall Street Journal. A 62-year-old piano teacher saw a three-bedroom bungalow that was listed as a short sale last summer in Georgia. The desperate sellers had dropped the original asking price of $159,000 to $129,000 and then to $79,900. Sensing that the market was awful, she offered $50,000. The sellers accepted $52,000 in cash.

While these purchases may make good sense, they aren’t necessarily smart investments. On April 25, I spoke again to noted real estate writer, San Diego State University lecturer and investor Leonard Baron about purchasing investment properties with cash. He reiterated that these investors must do a careful due diligence analysis to see if the property makes financial sense. Link to his terrific 7-page due diligence checklist on his website for the tool to enable you to do this – professorbaron.com. On the right side of his homepage, you will see the table of contents for his book. Link to Chapter One and it will take you to the checklist. Just scroll down a little until you see it. You can print it out and then use it for your analysis. You’ll be glad you did.

Would most of these older, all-cash buyers be searching for investment properties now if interest rates had not been pushed down so dramatically by the Fed? Think about it. If you were either close to retirement or actually retired, would you be plunking down anywhere from $50,000 to $1 million or more in cash on a house or condo if the interest rates on your Treasury securities, CDs, bonds, or money market funds were at historical norms?

The vast majority of these cash buyers (excluding perhaps some foreign investors) are not speculators. If they can land a decent tenant, the investment might make good sense. Yet do they really have a good idea about the state of the housing market where they are investing their hard-earned savings? If I thought they did, I would not have launched my Housing Market Report.

On the basis of my in-depth research, it’s quite clear to me that the “normal” housing market in most major metropolitan areas is shrinking. The percentage of sales in these markets which are distressed properties – either foreclosures or short sales – is climbing steadily. Conversely, the percentage of homeowners wanting to sell who still have equity left in their property is declining. My goal is to inform readers why this will not turn around anytime soon.

What Would Really Bring about a Dollar Dive?


One of the things about reading the op-eds and various articles in the blogosphere is the tendency to hype the possibility of the collapse in this, or the collapse in that. The most recent “bubble” in this type of writing involved hyper-inflation, commodities (silver, anyone?) and the dollar. Now I read things like QEIII would bring about a collapse in the dollar [1] (as if anybody really thought QEIII was politically likely, even if it were advisable on economic grounds); or easy monetary policy would be the culprit. Here’s a choice quote from Jim Rogers:

“I would expect to see some serious problems in the foreseeable future…. By 2011, 2012, 2013, 2013, I don’t know when, we’re going to have an economic slowdown again,” he said. “This time it’s going to be a real disaster because the US cannot quadruple its debt again. Dr Bernanke cannot print staggering amounts of money again.”

“How much more can they print without a serious collapse of the US dollar?” he said.
I can’t figure out where that cited “quadruple” comes from. Debt held by the public (in current dollars) has not even tripled since G.W. Bush came into office, and has not even doubled since Obama came into office (see FREDII if you don’t believe me). As a share of GDP, it rose from 0.49 to 0.63 from 2009Q1 to 2010Q4. Oh, well. Time to drop the hyperbole, and look at some data.

Some Facts

To begin with, I think it useful to ask whether we’ve actually printed a lot of money, where money is defined as currency plus checking deposits, or currency plus savings deposits (what we who teach macroeconomics, or teach money and banking, call M1 and M2).
dollar1 economy
Figure 1: Log ratio of M1 to real GDP (blue) and M2 to real GDP. NBER defined recession dates shaded gray. Source: Federal Reserve Board via FREDII, and BEA, 2011Q1 advance release, NBER, and author’s calculations.

As I’ve noted before, the Fed has more than doubled the money base, but this is not the same as doubling the money stock. That could happen if the banks lend out the excess reserves, but that hasn’t happened as of yet. For a discussion of the correlation of money base growth and inflation, see this post.

Thinking about Stimulus, Monetary Policy, the Dollar, and Timing

I’ve read a lot about how deficits threaten the dollar. And certainly they can, but I think one has to have a more nuanced view than “reduce the deficit immediately, or the dollar crashes today”. To think about this in an organized fashion, it’s useful to consider the dollar’s value in the context of several models. First, think about the dollar in a portfolio balance model [2] [3]. In a static model version of the model, the current stock of US government debt relative to that of other countries’ stocks of government debt drives the risk premium on dollar assets. A stable relationship obtains if (1) preferences for government debt are constant, and (2) the correlation of relative returns are constant. But the story of the 2000′s, and in some sense the “saving glut”, is that the preference for US government debt has not been constant (e.g., [Caballero et al.]). Rather central banks have exhibited an upward demand shock for US government debt.

It is entirely possible that there will be a negative demand shock for US government debt, going forward. But the story of the last three years has been a series of shocks that have impelled flight to, not away from, US government debt. So, while it is conceivable that there will be no further sovereign debt shocks in the rest of the world (in which case the increase in US debt might very well induce a weakening of the currency), right now, with 2011 US net debt at 72.4% of GDP (IMF WEO April 2011), it is unclear why we should have a dllar crisis when the Euro area has a 66.9% ratio, UK at 75.1% and Japan at 127.8%.

This is not to deny that the debt trajectory is worrisome, with net debt approaching 85.7% in 2016. But that means one needs to do serious entitlement spending restraint and tax revenue increases that will take effect in the future, not nickel and dime-ing the one-fifth of total current budget accounted for by discretionary non-defense spending today.

That leads to the second point, that spending restraint and the early withdrawal of monetary stimulus now would exert a drag on growth, which would also weaken the dollar. A relapse in growth would also worsen the depression in tax revenues which accounts for a large part of the accumulation of debt during the Great Recession; hence, even in a portfolio balance model, too-early fiscal contraction could actually instigate a dollar dive.

There are other drivers for the dollar’s value. Figure 2 highlights the correlation between GDP and the dollar’s strength, over the last 28 years.
dollar2 economy
Figure 2: Log real value of USD against broad basket of currencies (blue) and log ratio of US real GDP against RoW (export weighted) real GDP, detrended with quadratic in time. Source: Federal Reserve Board via FREDII, and BEA, 2011Q1 advance release, and author’s calculations.

Clearly, the strength of the dollar is correlated with the strength of the US economy relative to the rest of the world. (A DOLS(2,4) regression of the real dollar on relative GDP with a quadratic on time yields an elasticity of 1.82; however, the series do not appear to be cointegrated except at about the 20% msl.) There are a variety of reasons this correlation arises. The first is from the monetary approach [5] — higher income induces a greater demand for money, and in the monetary approach to the exchange rate, that leads to a stronger currency (when prices are sticky, as in the Dornbusch-Frankel model). Contractionary monetary and fiscal policy implemented now which leads to a lower GDP in the future would mean ultimately a weaker currency.

Second, the higher income is typically associated with a higher real interest rate differential, partly due to Taylor rule fundamentals (see [6] [7] [8] [9]) and partly because higher income leads to greater investment in physical plant and equipment (that’s how government spending could “crowd in” investment [10]), and hence demand for credit. That draws in capital leading to an appreciated currency.

The foregoing analysis places into context the proposals for fiscal retrenchment and monetary tightening now. The latter might induce a short term boost in the dollar’s strength, but both would almost surely induce a medium-term weakening.

It must be remembered that the dollar in and of itself is not usually thought of as a target variable. The dollar is a relative price that is key to re-allocating aggregate demand, and at the same time allocating capital, across borders. Drastic moves in the dollar’s value could indeed destabilize the financial system. But policy should not single-mindedly focus on the dollar’s value. That’s key for remembering why we want to stabilize the debt-to-GDP ratio — it’s to establish a sustainable path for output per capita over time.

How to Engineer a Dollar Crash

For certain, what would be key to causing a crash in the dollar’s value would be a failure to raise the debt ceiling in a timely fashion. In almost any model I can think of, that would either cause a flight from US government debt, or — even if we only go to the brink — elevating the risk premium, and hence total interest payments, on US Treasury debt indefinitely. Thus, it’s the height of irresponsibility to make unrealistic demands for deficit reduction based solely on spending cuts, thereby risking a crisis. [E.Klein] [M.Thoma]

5 Reasons Oil Prices Will Likely Stay High

by Sean Brodrick

After tumbling last week, crude oil prices rebounded hard this week. So who can blame investors for being confused? Are oil prices going to march higher again, or slump back to more “reasonable” levels? And what is reasonable after crude oil’s 30% surge higher this year?

Let me give you my reasons why I think crude oil prices are likely to stay high and go higher — and how you can play it.

Reason #1: Iraq Cuts Future Production Target in HALF.

Over the weekend, Iraq announced that it will now pump between 6.5 million and 7 million barrels per day (bpd) by 2017 — way, way down from its original plan of 12 million bpd.

It’s not because of low oil prices — oil prices have doubled since the 12-million bpd target was set two years ago.

Currently, Iraq produces about 2.68 million barrels a day, barely higher than under Saddam Hussein.

Advertisement

Iraq was one of the great hopes of the oil cornucopians — those folks who think we’ll always find more oil. Apparently, we aren’t finding it in Iraq.

Reason #2: The Saudis Failed to Cover Libya’s Shortfall.

You’ll remember that when Libya — the world’s 17th largest oil producer, 3rd largest producer in Africa and that continent’s largest holder of crude oil reserves — fell into civil war in February, its 1.6 million bpd production was quickly cut in half. Saudi Arabia said it would make up the difference.

Saudi Arabia DID pump more oil in February — but that was the culmination of long-term projects. But more recently, Saudi oil minister Ali al-Naimi revealed that the country’s crude oil production for the month of March fell by 833,000 bpd from February’s production level.

The Saudis blame lower demand for their sour crude. And maybe that’s true. But if so, this doesn’t do much to reassure the oil market that the Saudis can make up the difference when producers of light sweet crude falls short.

Also, before the Libyan crisis, the Saudis claimed they could tap 4.2 million bpd of spare capacity at any time. During the Libyan crisis, the Saudis downsized their claimed spare capacity to 2.5 million to 3.5 million bpd. 

And some analysts believe the Saudis only have 1 million bpd in spare capacity. That’s really not a lot of wiggle room if something else goes wrong … and something always goes wrong.

Reason #3: The Mystery in the Desert.

The Saudis are always up to something. Recently, Saudi Arabia announced it was going to spend $100 billion on solar, nuclear and other renewable energy sources. That is a lot of money for a country that is supposedly floating on all the oil and natural gas it should ever need.

The Saudis say they are doing this to boost the amount of spare oil they have for export. And to be sure, the Saudis currently consume 2.7 million bpd (27% of total production) and that is expected to grow to 8 million bpd by 2025. In case you’re wondering, us fuelhog Americans consume 19.5 million bpd.

Still, if the Saudis have all that spare oil, why don’t they just sink a few more wells? Unless, maybe, they don’t have that spare capacity. Hmm …

Reason #4: The Global Economy Runs on Oil.

The International Monetary Fund (IMF), expects global economic growth for 2011 to be 4.4%, according to a recent report. 

This will put more strain on a system that already saw global oil consumption grow by 2.6% in the first quarter of 2011, on top of 4.1% growth in the fourth quarter of 2010, according to the International Energy Agency.
What’s more, the second quarter typically sees an uptick in crude oil demand as refineries come out of maintenance. That should lead to higher oil prices.

Now the good news for U.S. consumers is that we are swimming in oil thanks to oil shale deposits that are coming into play — so much so that U.S. crude oil benchmark West Texas Intermediate trades at a $13-per-barrel discount to an international benchmark like Brent Crude. But that discount will come under pressure as more U.S. oil is shipped overseas to fast-growing economies.
Speaking of which …

Reason #5: Asia Puts the Pedal to the Medal.

While the IMF expects the world economy to grow at 4.4% pace, emerging market economies are growing much faster. The Asian Development Bank expects a growth in the region’s economy, of 7.8% and 7.7% for 2011 and 2012 respectively.

That’s bullish for oil prices because automobile ownership and gasoline and diesel usage is growing at a furious pace in those countries.

According to Financial Times, while European crude oil demand for February was largely flat, and U.S. oil demand might grow 2.9%, Asia as a whole is expected to see its oil demand rise 5.9% and China’s should rise 9.6%.

And it should keep rising. In China, a big driver has been growth in the domestic automobile market. Auto sales increased 2.6% in February, and March data released by the Chinese Auto Association shows sales grew 5.36% on a year-over-year basis.

There you have it — five reasons why oil prices should stay high. Of course, no one can foresee the future. There is a flip side …

Could Oil Prices Go Down? Yes, but You Wouldn’t Like It!

The one potential way that I see crude oil prices could really tumble is if we have a global recession. That would downshift those growing economies in a hurry and should send oil prices skidding lower.

But probably not for long. Why? Because existing oil fields are depleting — the average depletion rate is 5.1% per year, according to the Association for the Study of Peak Oil. So that cheap oil is being used up.

At the same time, the newer oil projects coming online require higher and higher break-even costs. Estimates of break-even costs for new oil projects range from $79 per barrel to $92 per barrel.

You can see the problem here: A “reasonable” price for crude oil gets higher all the time.

So, if oil prices dipped below those prices, the new projects would shut down. Soon, we’d have less supply coming on to the market. That, in turn, would force prices higher, whether the economy was in recovery or not.

How You Can Play the Next Surge in Oil

Oil explorers and producers are leveraged to the price of oil. One of the easiest ways to play what will likely be higher prices — and big fat profit margins for oil companies — is to buy the Energy Select SPDR (XLE). And the stocks that form the backbone of the XLE should also do well on an individual basis.

No one likes paying higher prices at the pump. But you can protect yourself and potentially profit with the right investments.
See the original article >>

German parliament backs euro fund: coalition member

by Andreas Rinke and Thorsten Severin

Reuters) - German Chancellor Angela Merkel will secure a parliamentary majority in favor of the planned permanent bailout fund for the euro zone, a senior coalition politician said on Saturday.

Some German media have reported increasing numbers of parliamentarians oppose the new, permanent European Stability Mechanism (ESM) taking effect in 2013 and there is disquiet over Greece's requirement for additional aid after last year's 110 billion euro package.


"At the end, we will always have a clear majority," Rainer Bruederle, parliamentary floor leader of junior coalition partner the Free Democrats (FDP), told a party congress in the city of Rostock.


FDP dissenter Frank Schaeffler said 40 to 50 members of the coalition -- Merkel's Christian Democrats (CDU), its Bavarian sister party the Christian Social Union (CSU) and the FDP -- were considering voting against the ESM.


That would wipe out the coalition's majority in a parliamentary vote planned for the autumn, but Merkel can count on votes from euro enthusiasts among the opposition Social Democrats and Greens.


Coalition leaders also say Schaeffler is exaggerating, that eurosceptics are isolated and the government would have majority support, as Merkel predicted this week.


The FDP congress is due to vote on two euro zone motions, one for and one against the ESM, later on Saturday.


The pro-Europe motion called for "strict parliamentary endorsement of every activation of the ESM" and backed Merkel's insistence on private investors sharing the burden of sovereign default risks in the euro zone in future.

See the original article >>

Follow Us