Monday, March 14, 2011

Gold Reversal Ahead?


Over the past several days gold has been hitting all time highs BUT the momentum indicator was telling us that the move was on greatly diminished strength.  Reversal Ahead?

GOLD :LONG TERM
From the long term stand point we are still nowhere in trouble with this bull market but things are starting to show weakness.  Gold remains above its positive sloping long term moving average line.  The long term momentum indicator (I use the 150 day RSI) remains in its positive zone but has now moved below its trigger line, although the trigger is still in a positive slope so this is just the very first stage of a momentum warning.  The momentum indicator is well below its levels from the Nov to Dec period when gold was about at the same price level as now.  The one indicator that continues to be on a tear is the volume indicator.  It is still right up there at all time high levels and above its positive sloping trigger line.  All in all the long term rating remains BULLISH.

INTERMEDIATE TERM

A two year bull move seems to be sputtering and having difficulty moving higher.  The chart very clearly shows the topping process with the intermediate term momentum showing continued reduced strength as gold was trying for higher ground.  Since the momentum indicator reached into its overbought zone way back in early Dec of 2009 the subsequent new highs have been on lower and lower momentum readings.  Although we usually look at the neutral momentum line (at 50%) as the dividing line between positive and negative momentum gold seems to have established a very solid level at about the 47.5% level as the strong support level.  This is the level to now watch to see if the momentum shifts to the negative side.  Yes, the momentum is heading lower and one can say its trend is negative but it is still slightly inside its positive zone.  With all that has been going on in the world these past several weeks one should have expected gold to be zooming into the stratosphere.  The momentum indicator shows that, at this time, the strength is just not there for such move.

The other feature that jumps out at you is the long up trending channel that has trapped gold for the past two years.  Remember, momentum is a warning.  One would not declare the direction of the security based solely on momentum.  One needs to also check the trend of the price.  The price could continue on its merry way for a long time with a steadily diminished momentum reading so it’s important to check the trend also.  Here, as long as gold stays inside that channel one might continue to suggest that the trend remains positive.

Having said all that I still go to my normal indicators for my final reading as to the rating for the period.  Gold is still above its positive sloping intermediate term moving average line.  The intermediate term momentum indicator is still in its positive zone but moving lower and has already crossed below its trigger line.   The trigger has also turned to the down side.  The volume indicator remains quite positive and above its positive sloping trigger line.  For the intermediate term the rating remains BULLISH but starting to weaken.  The short term moving average line remains above the intermediate term line for confirmation of this rating.

SHORT TERM

The short term is showing a little more weakness than the other time periods but it’s not yet in the bear category.  Trend changes are usually (but not always) noted in the short term first.  Here, the price of gold did drop below its short term moving average line on Thursday and the line did turn negative just a wee bit but on Friday gold was back just above its moving average line and the moving average turned back just a wee bit to the up side.  We are in an area that any up and down move by the price of gold could change the indicators so unless we get a trend we may be in for more volatility on a daily basis.  The momentum indicator remains just above its neutral line in the positive zone.  It also is moving lower and is below its negative sloping trigger line.  As for the daily volume action, it is somewhat questionable as to its message.  Friday the daily volume was above its average volume of the past 15 days for a good sign as the day was an up day in the gold price.  However, the day before the volume was a little bit higher and also above its 15 day value but that was a down day for the gold price.  So, no real message that you can grab on to.  All in all, as of the Friday close the short term rating is BULLISH but very iffy.  The very short term moving average line is just above the short term line for confirmation of this bull BUT it is moving lower fast and could very easily cross below the short term line on another down gold day.

As for the immediate direction of least resistance, I’ll go with the down side, although there may still be another day or so of upside movement.  The topping process seems to have been completed with the Stochastic Oscillator in its negative zone and still in a downward drift.  The very short term moving average line remains pointing downward and the trend is still towards lower levels despite Friday’s advance.

SILVER

 Silver remains in a short term up trending channel since late Jan.  It seems to want to break to the down side but still remains in the channel.  The recent move into new highs was with slightly diminished momentum but not to the point of being a concern yet.  Although still out performing gold it does appear that silver is getting ready for some sort of reaction to the bull move and new commitments in this area should be carefully reviewed, as they should always be.  All three time periods are still BULLISH as far as the ratings go.

PRECIOUS METAL STOCKS

 It has not been a good week for precious metal stocks, as the Table below indicates.  Dangerous times may be ahead for investors and speculators.

See the original article >>

BOJ eases further, expands asset buying programme

by Rie Ishiguro

(Reuters) – The Bank of Japan eased its ultra-loose monetary policy further on Monday by expanding its asset-buying programme while keeping rates on hold.

KEY POINTS:

-- The BOJ kept interest rates unchanged at a range of zero to 0.1 percent by a unanimous vote.

-- Governor Masaaki Shirakawa will hold a news conference with his comments expected to come out sometime after 4 p.m. (0700 GMT).

COMMENTARY:

NAOKI IIZUKA, SENIOR ECONOMIST, MIZUHO SECURITIES, TOKYO

"The economy may develop differently from the BOJ's scenario and there is a possibilitythat growth may contract in January-March and April-June.

"The BOJ responded quickly to the situation by implementing additional easing policies as the economy may be in a phase of entering a recession from the previously view that it was emerging from a lull.

"There is a chance that the cost of the damage from the quake could be twice as big as the one caused by the Great Hanshin-Awaji (Kobe) earthquake. Economic activity may slow down toward April-June."

MASAMICHI ADACHI, SENIOR ECONOMIST, JPMORGAN SECURITIES JAPAN
"My initial impression is that the BOJ could have done more. Its traditionally reserved stance on policy easing remains in place even after the massive earthquake.

"The BOJ also kept its economic assessment unchanged. The bank thus seems to be not fully taking account of strong uncertainty shrouding Japan.

"There are some positive aspects, such as its plan to increase ETF purchases. But overall the BOJ action is unlikely to be a positive factor for markets."

BACKGROUND:

-- Early on Monday the BOJ injected a record 7 trillion yen ($85 billion) into the money market, its first same-day market operation since the Greek debt crisis, to soothe market jitters in the wake of a massive quake and tsunami that triggered what could be the world's worst nuclear disaster in 25 years.

-- The bank quickly followed up on its action by infusing an additional 5 trillion yen and offering to purchase 3 trillion yen worth of treasury bills and financing bills.

-- The BOJ eased monetary policy last year by pledging to keep interest rates effectively at zero until the end of deflation was in sight and by crafting a pool of funds to buy assets ranging from government bonds to corporate

-- Japan is battling to prevent a nuclear catastrophe and to care for thousands of people without power or water in its worst crisis since World War Two, after a massive earthquake and tsunami
that are feared to have killed more than 10,000 people.

Japan warns against rapid yen rise after earthquake

By Tetsushi Kajimoto

(Reuters) – Japanese authorities warned against the yen's rise as the currency rallied broadly early in Asia on Monday following Friday's devastating earthquake and tsunami in Japan.

Finance Minister Yoshihiko Noda said he is closely watching yen moves, while one of his senior staff vowed to take decisive steps on currencies if needed, signaling Tokyo's readiness to step in to curb rapid yen rises.

The Japanese currency had risen sharply on Friday on talk of repatriation flows as the disaster unfolded. On Monday, the country was battling to prevent a nuclear catastrophe and to care for millions of people without power and water.

The dollar skidded to a low around 80.60 yen on trading platform EBS, compared with 81.87 yen late in New York on Friday, before quickly paring losses to last stand around 81.60.

"At this stage, I'm closely watching," Noda told reporters when asked what the government would do in response to rises in the yen.

Noda's comments came after a senior finance ministry official said Japan is ready to act decisively on currencies when needed.

"There is no change in our stance that we'll take decisive steps on foreign exchange when necessary," the official told reporters.

See the original article >>

Help Japan

Signal Noise has this poster for sale — all profits will be donated to help Earthquake/Tsunami relief efforts in Japan.

In the USA, you can text REDCROSS to 90999 to donate $10 . . .
>

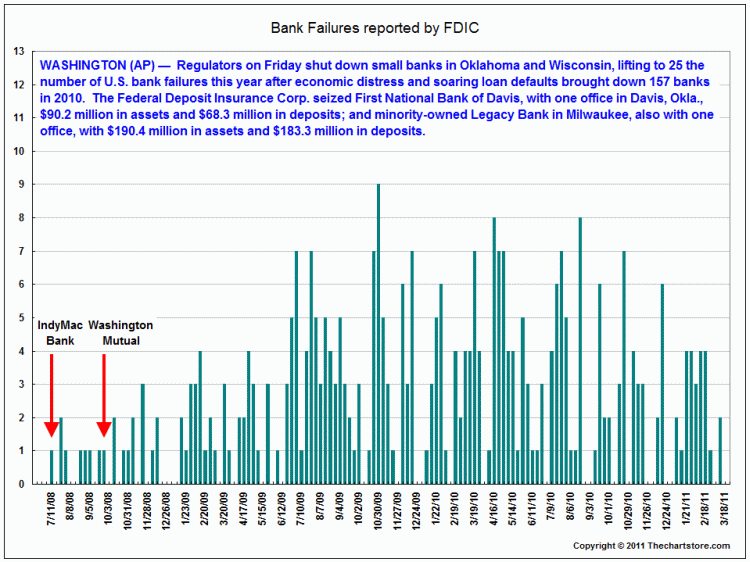
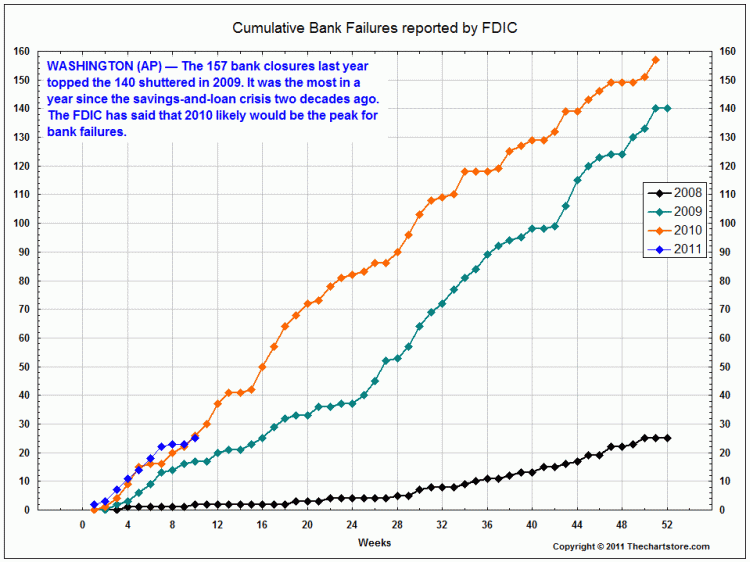
FDIC Bank Failures

By Barry Ritholtz

Another few takeover the past week:
>

~~~

See the original article >>

EXPENSIVE MARKETS MEAN LOW OR NEGATIVE PROSPECTIVE RETURNS

By JJ Abodeely, CFA

As discussed in previous posts, the benefit of a normalized P/E ratio (and a historical perspective) is that it gives us cues on whether the current price of the market is cheap or expensive and thus whether future returns will be high or low.

The S&P 500 Normalized P/E ratio as calculated by Robert Shiller stands at 23.3. Ed Easterling’s work produces similarly elevated valuation levels. Not only is this well above the long-term average, but it is consistent with very disappointing long-term expected returns.
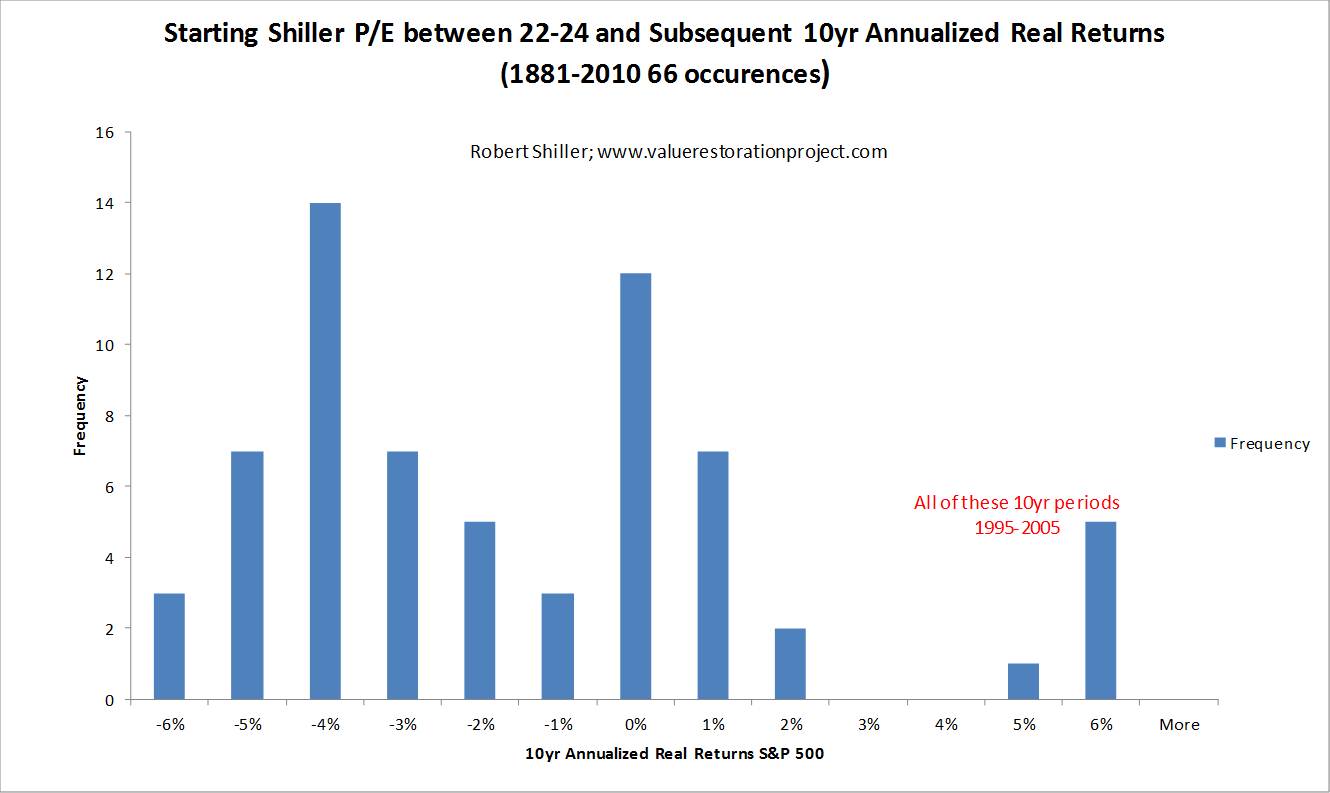
But just how disappointing are returns likely to be? I spent a few hours on Friday afternoon geeking out in excel. I found that when the cyclically adjusted P/E ratio is between 22 and 24 (as it is now) the average annual real returns (after inflation) for the subsequent 10 years is -2.6%! And as usual, the average doesn’t quite tell the whole story. In the 66 month ends since 1881 when the P/E was between 22 and 24 the distribution of subsequent returns looks like this:
The median return is -3.7% real. It seems exceedingly likely to me that long-term returns for the stock market from here will be negative. I don’t think most investors are prepared for these sort of outcomes over the next decade.

Several successful investors use the same concepts to drive actual estimates of future market returns.

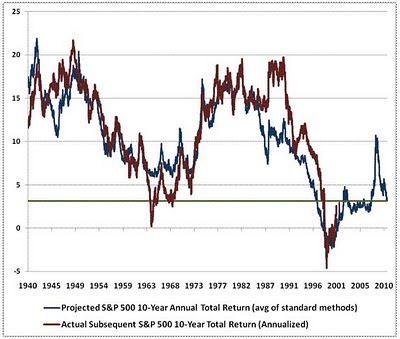
John Hussman, PhD uses this methodology to help drive decision making with his mutual funds. His recent work produces estimated NOMINAL returns over the next 10 years of 3.1% annualized which may be close to zero real returns depending on inflation.
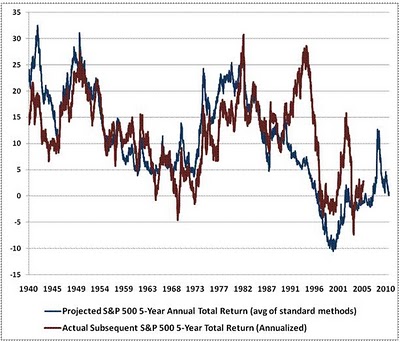
Using a 5 year time frame, the “probable outcomes” are even worse, with 0% projected nominal returns.
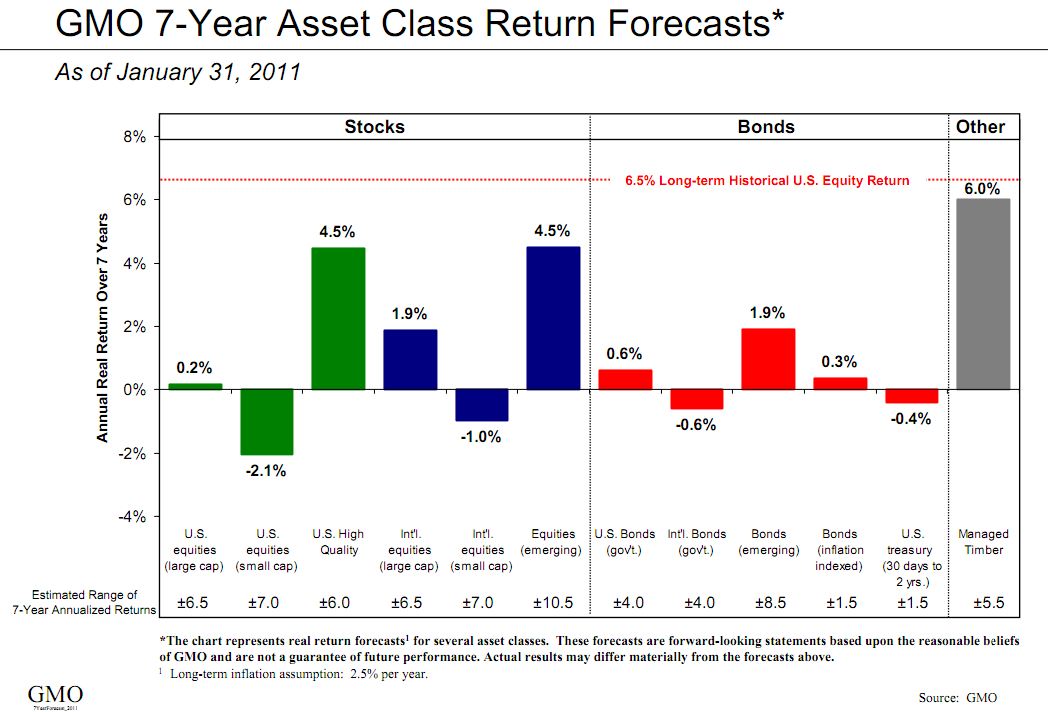
GMO does similar work with additional emphasis on where profit margins are relative to normal (and likely to revert towards) and does so across various asset classes and publishes their results monthly. These are also nominal returns and are certainly not high enough to warrant a buy and hold or long-only approach especially when one considers that this is just a range of estimates and the downside to low estimates is equally as likely as the upside.
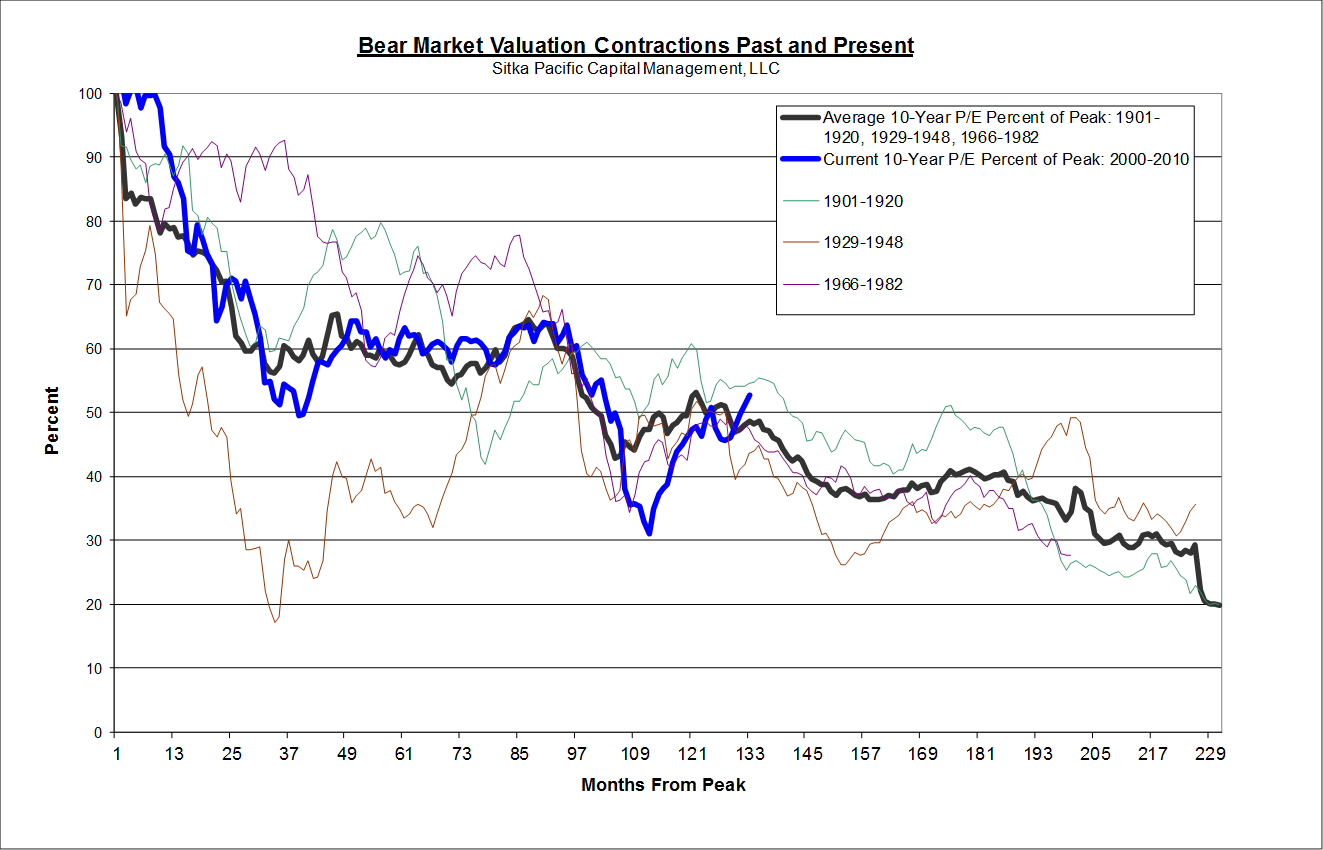
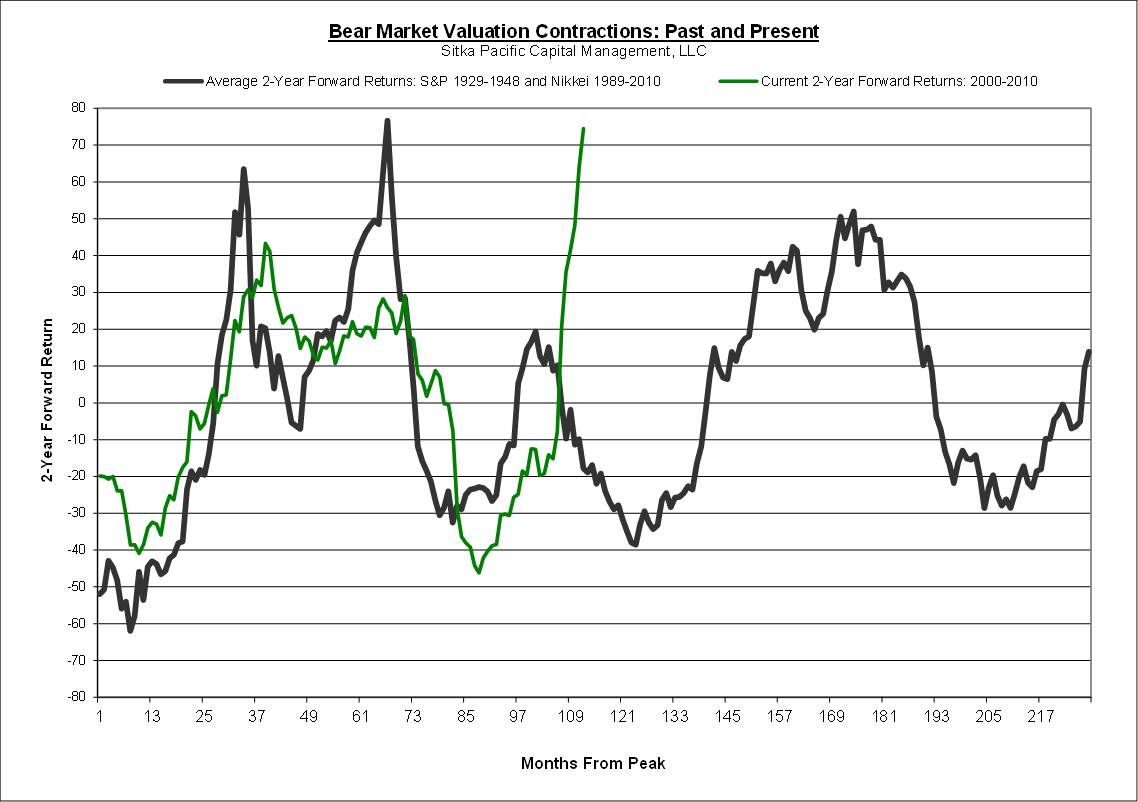
The fact is that what you pay matters and expensive markets today mean low or even negative prospective returns going forward. The value restoration project, which began with the peak of the stock market in 2000, is ongoing despite a 2 year cyclical rebound on the heels of unprecedented stimulus.
Read the Sitka Pacific Annual Review for more on the multitude of challenges facing investors.

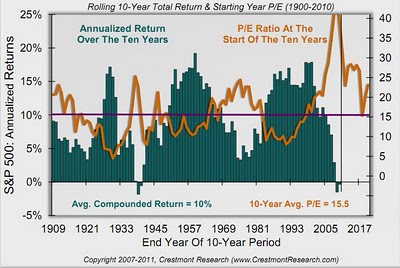
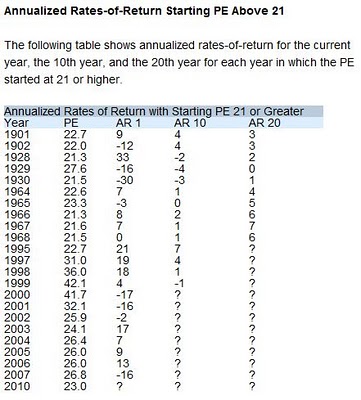
Of course, in the short term the market can get more expensive. Those calling for negative returns in 1997 or 1998 based on this sort of methodology were certainly frustrated over the course of the next 2 years as the market when from merely expensive to insanely bubblicious. My colleague Mish had a nice post looking at the returns over various time periods when you start with expensive markets. In the first year the returns ranged from -30% to +33%.
I believe this are nominal returns which means that all of those single digit 10 year returns starting in the late 60s were certainly negative after the effects of inflation.

Secular bear markets ALWAYS have powerful rallies which has nothing to do with the fact that bear markets NEVER end until the market is “not just interesting, but rather commandingly, and compellingly cheap.” I don’t portend to have a crystal ball, but it seems to me that our powerful bear market rally is getting rather long in the tooth.

Follow Us