by Greg Harmon
Last week’s review of the macro market indicators suggested, heading into the end of February saw the Equity markets as strong moving out of consolidation higher.
Elsewhere looked for Gold ($GLD) to continue lower in the short term while Crude Oil ($USO) continued to consolidate after its bounce. The US Dollar Index ($UUP) also looked to continue to consolidate sideways while US Treasuries ($TLT) were biased lower. The Shanghai Composite ($ASHR) and Emerging Markets ($EEM) were both consolidating with a bias to break that to the upside.
Volatility ($VXX) looked to remain subdued keeping the bias higher for the equity index ETF’s $SPY, $IWM and $QQQ, despite the moves higher the past week. Their charts also suggested more upward price action on both the daily and weekly view. This was the first week in a while that all 3 Index ETF’s looked strong.
The week played out with Gold probing lower before finding support at 1200 again while Crude Oil drifted lower in its consolidation. The US Dollar moved moved sideways but to the top of the range by the end of the week while Treasuries had a small bounce before pulling back. The Shanghai Composite came out of the holidays to the upside while Emerging Markets tried to move higher but stalled.
Volatility drifted to a new low for 2015. The Equity Index ETF’s rose on this combination but gave back most or all of the gain by Friday. All were in a tight range all week. What does this mean for the coming week? Lets look at some charts.
SPY Daily, $SPY 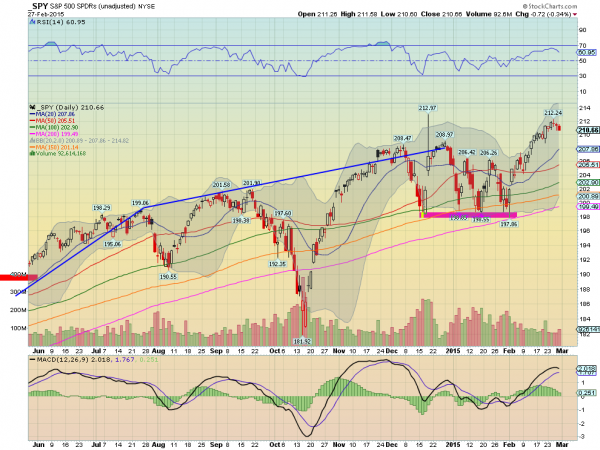
The SPY started the week with a whimper, moving slightly higher after the big move the Friday prior. A slight drift higher through to a new all-time high close Tuesday and failed attempt at another Wednesday led to a small pullback and slightly lower close on the week. The daily chart shows the RSI rolling over, but still firmly in the bullish zone, while the MACD is also turning lower.
Out on the weekly chart the breakout held but with a small candle and an upper shadow. Could be consolidation or a signal for a pullback. Perhaps a retest of the range break out. The RSI is turning down on this timeframe, but remains bullish, while the MACD is rising after crossing up last week. There is resistance higher at 212 and Measured Moves to 215 and 225 above that. Support lower comes at 210.25 and 209 followed by 206.40. Possible Pause or Pullback in the Uptrend.
SPY Weekly, $SPY 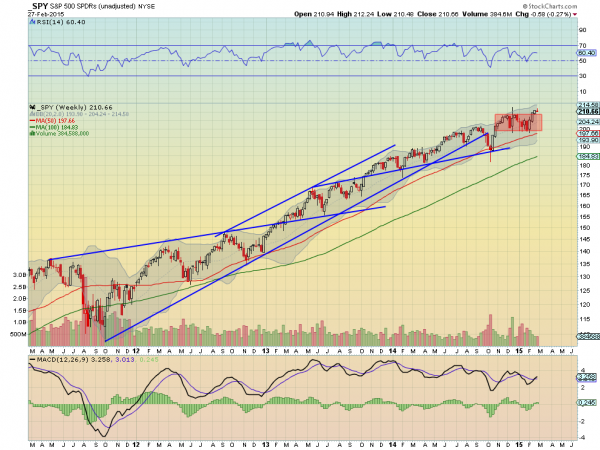
Heading into March the strength that was anticipated to close February did not appear, but weakness did not show up either. Elsewhere look for Gold to continue the short term bounce higher while Crude Oil churns in the consolidation of the downward move. The US Dollar Index seems ready to move higher again while US Treasuries are biased higher short term in the pullback. The Shanghai Composite is on the cusp of another leg higher and Emerging Markets are stalled at resistance but not showing any bias.
Volatility looks to remain subdued and may drift lower keeping the bias higher for the equity index ETF’s SPY, IWM and QQQ. Their charts are not as strong with consolidation or a pullback looking more likely in them, especially the SPY with the IWM next and QQQ strongest, holding level. Use this information as you prepare for the coming week and trad’em well.
No comments:
Post a Comment