by Greg Harmon
It is just 1 trading day shy of 4 months since the SPDR S&P 500 ETF ($SPY) made its October low. Think about what has happened in that time. Japan expanded its Quantitative Easing. The ECB starting Quantitative Easing. Greece moved to the precipice of disaster….again. Putin has either invaded Ukraine, or freed them or something. Now we will help too (not sure which side). The US economy has been described as slowing, exploding and everywhere in between. We are going back into Iraq, gathering support to fight the Islamic State and shutting out embassy in Yemen.
Through all this the SPY moved up to new all-time highs quickly in the standard ‘V’ recovery and has basically done nothing since Thanksgiving. But there are signs that all that is about to change.
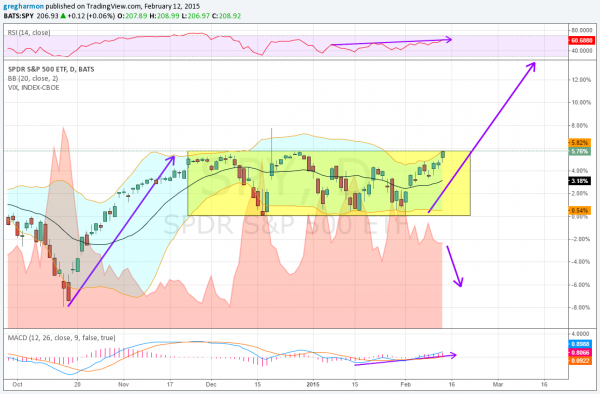
The chart above shows the price action for the SPY since October low with the Volatility Index ($VIX) as an area chart behind it. There is a lot to note on this chart. First the basics. The SPY peaks correspond to troughs in the VIX and when the VIX spikes the SPY has found a low. There is a negative correlation.
Now notice the blue shaded Bollinger Bands® surrounding the SPY price candlesticks. Each bottom in the SPY has happened at the bottom of the Bollinger Bands. The highs do not have such a clear cut signal. But each of the 4 highs in the channel since the October low have happened with the upper Bollinger Band flat or falling. This move higher is different. That upper Bollinger Band is moving higher, allowing the price candles to move higher, not containing them.
Some other things are different too. Since the start of the year, the RSI has been slowly trending higher. This momentum indicator is now breaking 60, a level that turns it bullish. The other momentum indicator, the MACD, has also reversed trend higher. These support more positive price action. Finally, look at the spiky VIX hills themselves. Notice that the valleys have all been lower than the current level. The VIX can go lower. Remember that stuff above about it being negatively correlated to the SPY? The SPY can go higher then.
So the SPY has momentum on its side. Bollinger Bands opening to the upside and a VIX that could let it rise more. How high can it go? One measure is that the move into the consolidation box will be equal to the move out of the box. The two rising purple arrows show that and the higher one points to a level of 224 in the SPY. This does not mean it will happen or if it does it will happen quickly. But if the SPY does break the box to the upside, it has all the makings for this time to be different.
No comments:
Post a Comment