by Greg Harmon
Gold has a long and storied history. It has been prized by kings for centuries. Empires were built on it. It has backed entire countries. It has been used to monitor economic growth and inflation. And when there is global conflict it is seen as source of safety for capital. But much of that history, is history. In crisis money flocks to US Treasuries or the US Dollar now. I suppose that if the US were in crisis then Gold might make a comeback.
Many pundits have made a name for themselves during the big 10 year bull market run in Gold that went from 2001 until 2011. Unfortunately they still espouse on the virtues of Gold like nothing has changed. But in terms of its actual usefulness it is now pretty limited. That does not stop sentiment and emotional buying though. And It probably never will. And as one of the most active contracts in the futures market it trades well with technicals. So even with no real value or scarcity, what does the chart say about its future? Its at a crossroads.
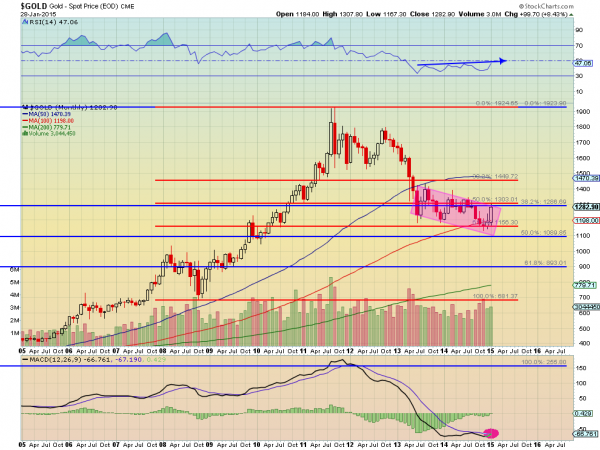
The monthly chart above shows only the last ten years. The full move from 2001 until 2011 is measured by the blue Fibonacci lines. The smaller move following the retracement in 2008 is shown with the red lines. These Fibonacci retracements can play a major role for traders.
There are a few things that stick out from these levels. First there are two retracements that are tightly bound at 1286 and 1303. This can help explain the magnetic like pull of the 1300 level. The second thing to note is that the break lower at the end of the year retraced to the 61.8% level on the shorter move.
This is a major retracement and weakness below this level would suggest a much deeper correction. So it is promising that it has moved higher back towards the 50% level into the end of January. On the broader scale the 38.2% retracement held it for a long time. And the move back toward that level is also promising. It would be a shallow retracement if it were to reverse higher from this point. But there is no reversal yet.
Aside from the Fibonacci’s there is the 100 month SMA that has come into play recently. It has acted as support the last few months and could contribute to the bottoming process. But there is also the falling channel in pink that has been active for 2 years. Notice that the latest move higher is testing the top of the channel. Also note that the channel is falling in the direction of the correction, more like a pennant than a bear flag. This type of price action often leads to a reversal.
Finally the momentum indicators are diverging from the price action. Not strongly, but the MACD is is leveling and has been so for a year, while the RSI has been in a slight upward trend for the last 18 months.
But all the indicators mean nothing if the price does not confirm. It would take a solid break and hold over 1340 to confirm a bottom and reversal higher. Then a move over 1450 would strengthen the trend and look for a major move higher. But a break of the channel to the downside, and below 1140 would look for an acceleration of the downtrend and a target of the 61.8% retracement of the broad move to 893. Until then look for the slow downward drift to continue, maybe as far as 1090.
No comments:
Post a Comment