by Greg Harmon
Last week’s review of the macro market indicators suggested, as the market heads into September, that equities were strong but had strong moves already. Elsewhere looked for Gold ($GLD) to continue to hold around 1300 with a downward bias while Crude Oil ($USO) had a short term bias higher in its consolidation. The US Dollar Index ($UUP) and US Treasuries ($TLT) were biased higher. The Shanghai Composite ($SSEC) looked to continue to pullback in its recent rally while Emerging Markets ($EEM) were biased to the upside with the risk of consolidation at resistance continuing. Volatility ($VIX) looked to remain subdued keeping the bias higher for the equity index ETF’s $SPY, $IWM and $QQQ. The IWM looked strongest and this may be a sign of rotation into it from the SPY and QQQ. The QQQ looked a bit better than the SPY having rested all week, where the SPY had some signs of short term exhaustion. But the trend of SPY and QQQ both remained higher.
The week played out with Gold probing lower but still close to 1300 while Crude Oil started higher but but failed, holding steady. The US Dollar moved higher like a rocket while Treasuries started lower and just kept falling. The Shanghai Composite broke out higher while Emerging Markets found support and then moved to new highs. Volatility held at last weeks levels with a few probes higher that failed. The Equity Index ETF’s pushed to higher highs but could not hold them at first. But Friday changed that with the SPY making another new all time high close. What does this mean for the coming week? Lets look at some charts.
As always you can see details of individual charts and more on my StockTwits feed and on chartly.)
SPY Daily, $SPY 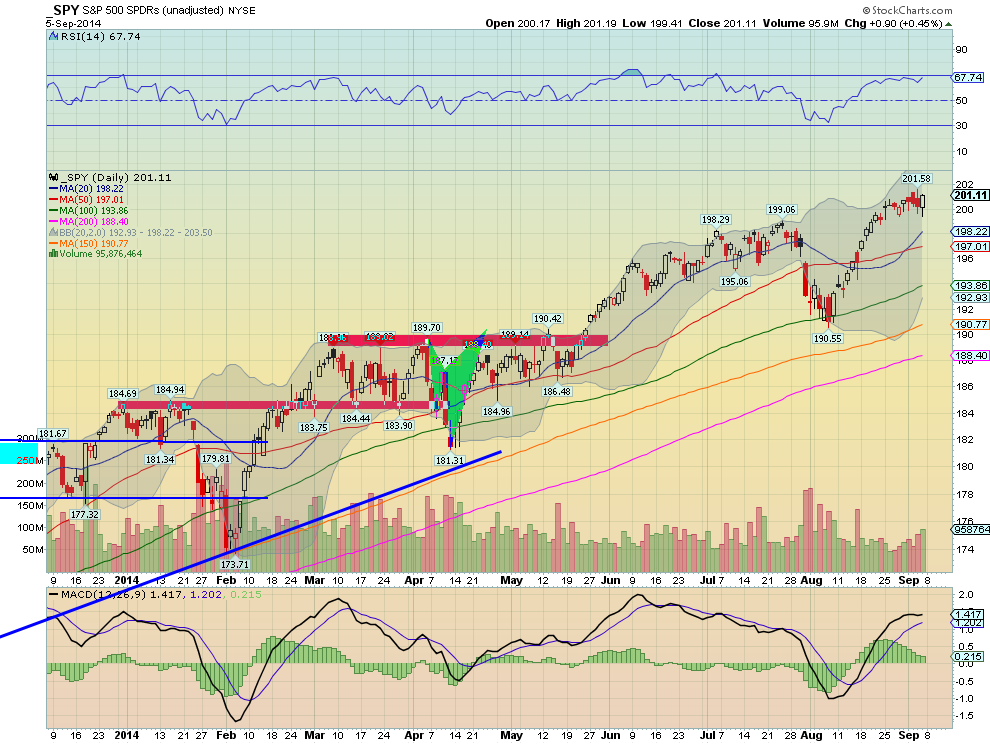
SPY Weekly, $SPY 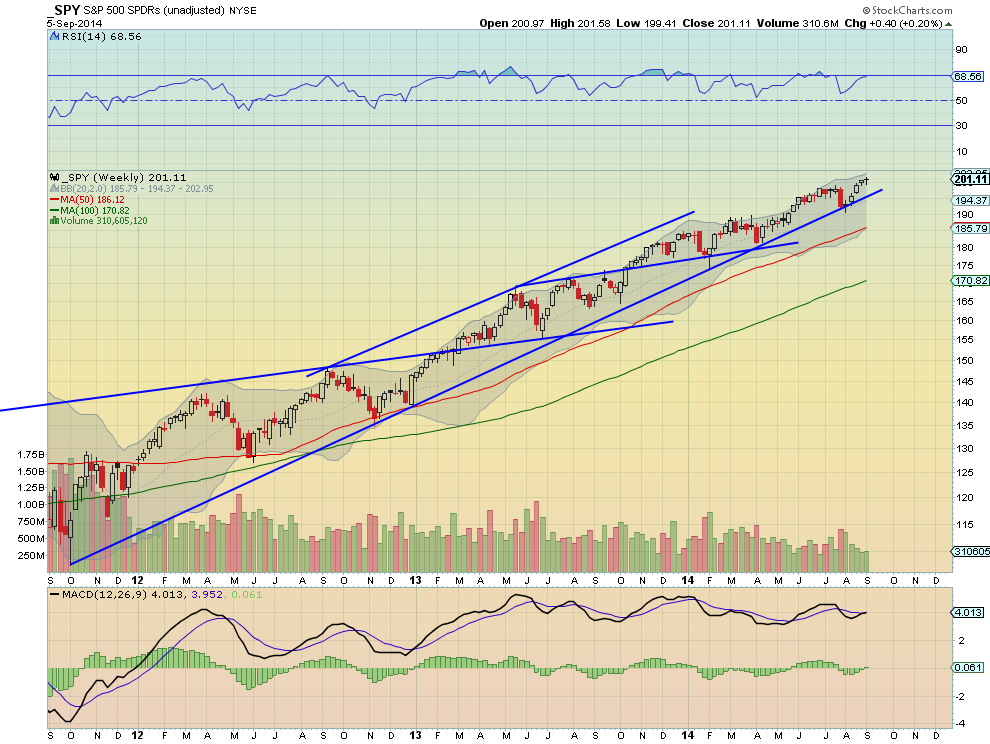
The SPY had both the bulls and bears squawking again this week. First it was the bears with second Hanging Man candle and then a bearish engulfing candle and a Spinning Top confirming them lower. But Friday showed a strong finish to the week closing at a new all-time high level. The excitement dissipates a bit if you look at the full week and the prior in the context of consolidation at the highs and the round number 200. The RSI is strong and in the bullish zone on the daily chart and the MACD is leveling but also bullish. Out on the longer weekly timeframe the doji print will bring out some top callers. But a doji means indecision, not reversal, and can resolve in either direction. The RSI is strong and bullish on this timeframe as well with a MACD that is about to cross up. There is no resistance higher but a target of 202.78 as a 150% extension of the major move lower followed by a Measured Move to 208 and the 161.8% extension to 213.39. Support lower may come at 200 and 199 followed by 198.30 and 196.50. Consolidation Short Term with an Upward Bias.
As the kids are back to school and the adults file back into work from vacations the equity markets are looking strong but with short term consolidation likely. Elsewhere look for Gold to continue lower but not stray much from 1300 while Crude Oil consolidated in its downtrend. The US Dollar Index looks strong and higher while US Treasuries are biased lower in the uptrend. The Shanghai Composite is also strong and biased higher along with Emerging Markets. Volatility looks to remain subdued keeping the bias higher for the equity index ETF’s SPY, IWM and QQQ. Their charts show signs of consolidation in the short run with the SPY and QQQ a bit strong on the longer timescale. Use this information as you prepare for the coming week and trad’em well.
No comments:
Post a Comment