by Greg Harmon
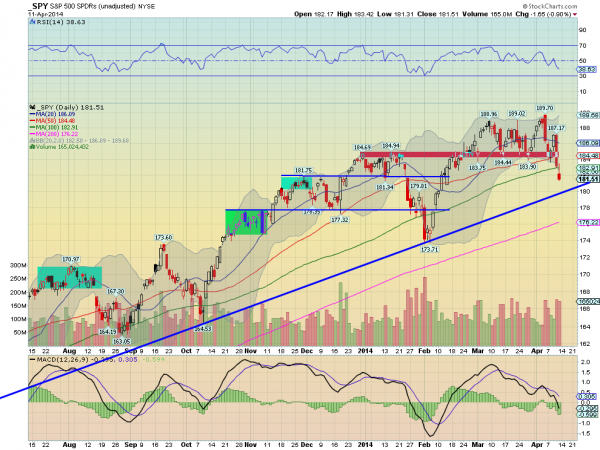
| Last week’s review of the macro market indicators suggested, moving into the next week that equity markets continued to look weak. Elsewhere looked for Gold ($GLD) to move higher with Crude Oil ($USO) in the short term. The US Dollar Index ($UUP) and US Treasuries ($TLT) were also biased to the upside with a chance that Treasuries just churn their wheels sideways. The Shanghai Composite ($SSEC) was poised to consolidate in the downtrend while Emerging Markets ($EEM) were biased to the downside in the short run after a strong move higher. Volatility ($VIX) looked to remain subdued keeping the bias higher for the equity index ETF’s $SPY, $IWM and $QQQ, despite the moves lower last week. Their charts did not share the upside optimism in the short run with the SPY the strongest pulling back near support, the IWM next at support but weak and the QQQ looking lower in the short run. The longer view was similar with the SPY the strongest and consolidating while the IWM was at support and the QQQ moving lower. The week played out with Gold continuing higher as Crude Oil moved up as well. The US Dollar moved lower all week before a small bounce Friday while Treasuries marched higher to the previous long tail. The Shanghai Composite moved higher out of consolidation while Emerging Markets finally met some resistance and consolidated. Volatility picked up a bit and closed the week with a wild range Friday. The Equity Index ETF’s all ended lower on the week with Spinning Top indecision candles, and the SPY below the 100 day Simple Moving Average (SMA)for the first time in two months and the IWM a hair from the 200 day SMA a place it has not visited since November 2013. What does this mean for the coming week? Lets look at some charts. As always you can see details of individual charts and more on my StockTwits feed and on chartly.) SPY Daily, $SPY 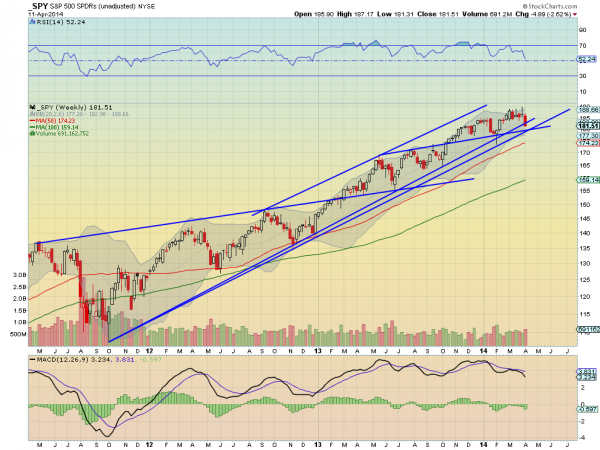 The SPY started the week falling to support where it had bounced twice before but with the added support of the 50 day SMA. It did bounce again but only for 2 days before resuming the move lower through the 100 day SMA and finishing at 2 month lows. The daily chart shows that there is rising trend support nearby around 180 and with it out of the Bollinger bands some volatility players may start to buy. The RSI though on the daily chart continues to move lower along with the MACD. The weekly chart shows a strong move lower from consolidation through one rising trend line and approaching the cross of two others. It may be time to erase the higher long term trend line. The RSI is falling and near the mid line, so still in the bullish range while the MACD is heading lower. Both support more downside. Support lower comes at 180.25 and 117.75 followed by 174.25 and 174. Below that and the long term uptrend is in jeopardy. Resistance higher stands at 181.80 and 184 followed by 186.75. Continued Downside in the Long Term Uptrend. Heading into the shortened Passover and pre-Easter week the equity markets look to continue lower. Elsewhere look for Gold and Crude Oil to continue their moves higher. The US Dollar Index looks weak and headed lower, but with support nearby while US Treasuries may be ready to break the long consolidation to the upside. The Shanghai Composite and Emerging Markets look strong with a chance that Emerging Markets consolidate for a bit. Volatility looks to remain subdued keeping the bias higher for the equity index ETF’s SPY, IWM and QQQ, but it is biased to the upside and under watch. The equity index ETF’s themselves show no signs of a reversal higher, only a continuation lower. They all still have room to major trend reversal levels but it appears the short term direction is firmly lower. Use this information as you prepare for the coming week and trad’em well. |
No comments:
Post a Comment