This post will include an excess of charts and graphs, ostensibly to put to rest any weather notions as well as highlight the macro component of what is clearly economic dysfunction. The beginning of 2013 was bad in its own right, but the excuses laid then pertained to QE’s lag (as well as winter grumbling). Since QE3 wasn’t inaugurated until October 2012 (first MBS purchase and settlement), and QE4 December 2012, there was some plausibility (gullibility) to the idea QE hadn’t had time to create the virtuous cycle its practitioners promised.
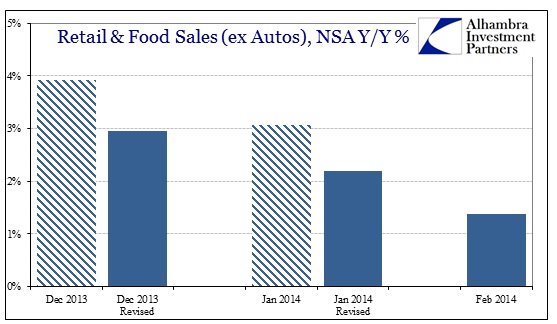
Now in February 2014, that excuse is no longer valid, particularly in light of the inventory cycle that I maintain is the sole imprint of QE on the real economy (the financial economy is another matter altogether). The just-released February retail sales figures are worse than January, by quite a bit, even in comparison to the downward revisions in January (and December).
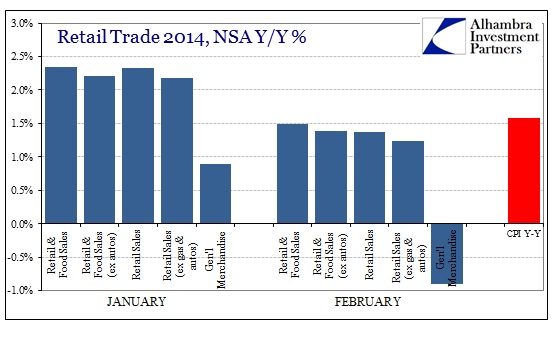
In every subcategory of retail trade, February’s growth was less than the latest CPI figures, meaning that in real terms (or as close as we can estimate using official inflation estimates) February saw contraction across the retail trade industry. That comes after January was barely positive in real terms (less than 1% across the board). Given the cycle highs for inventory levels, these are particularly bad results that portend much more weakness in production ahead (and very bad news for China).
Where we can rule out any QE lag effects, that leaves the weather and the rolling Polar vortices that have struck across these past few months as mainstream distractions. Here too we can eliminate that possibility with the simple exercise of not ignoring the recent history beyond this winter.
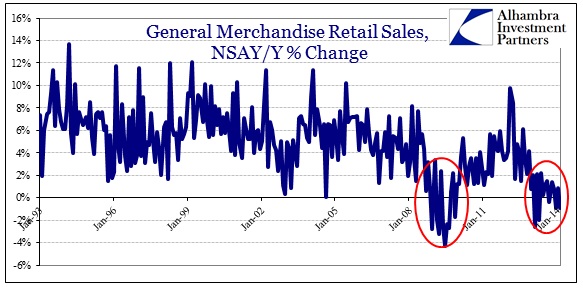
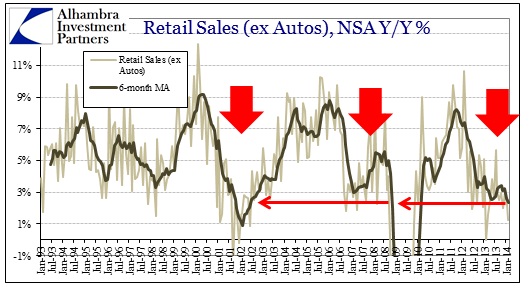
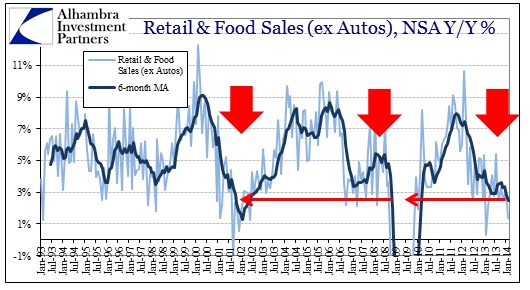
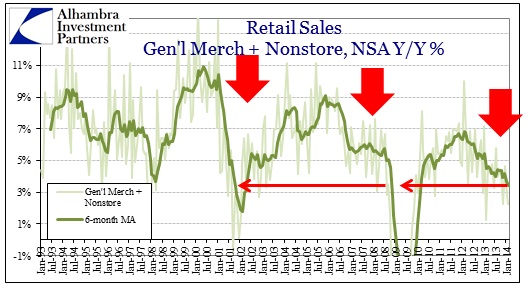
In all these data points, two conclusions can be drawn without ambiguity. First, there was a massive and dramatic slowdown in the middle of 2012 that has persisted without interruption since. Second, the 6-month average for every segment shown here is the lowest since 2009. Since a 6-month lookback period reaches to September 2012, that would certainly control for any wintry interference. If that is not enough to forestall any cold appeal, then we can simply put the past six months in context with other periods of more well-known “cyclical” determinations.
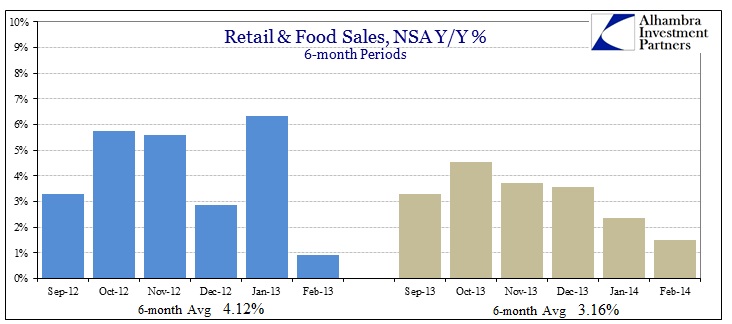
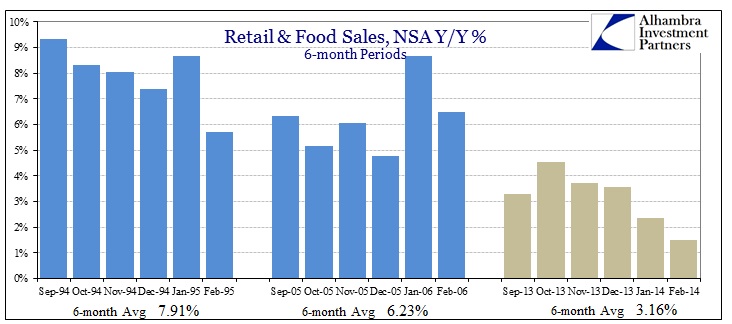
The last 6 months were significantly worse than just a year before, averaging almost a full percentage point below.
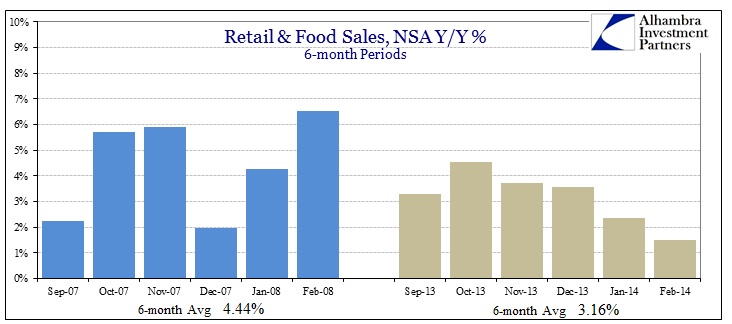
Compared with the opening months of the Great Recession, retail trade has fared worse in nominal terms. Even adjusting for inflation, the results are extremely similar.
There is no mistaking the last 6 months for any avowed period of actual growth, inflation or not. Despite QE’s proclaimed promise, the results are conclusive of what has actually been delivered (finance vs. real economy).
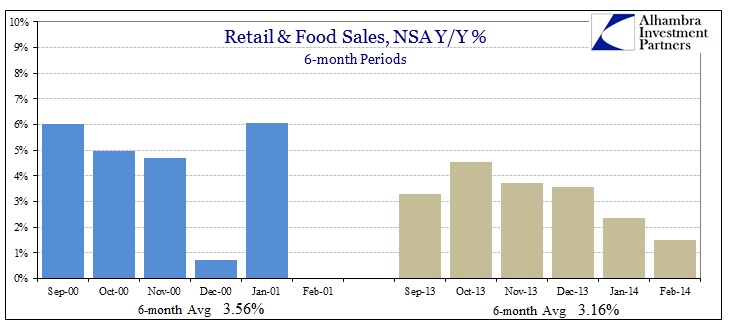
In terms of comparison, the closest period for an analog of retail trade is actually the months leading up to the dot-com recession that began in March 2001.
Given how all of this aligns with what we have seen recently (and for more than a year) with anecdotes of all shapes and sizes, it seems pretty clear that there is a macro factor that subsumes all these other interpretations. Again, the only way these additional explanations make any sense is if you are totally biased by ideology that QE beneficence is a given.
Setting aside any question of cycle or whether recession is at hand, QE at the very least promised better economic conditions. These, and so many others, show that conditions are worse than when QE began (or even compared to just a year ago). That will likely lead us back in full circle to the “created vs. saved” debate, where practitioners will begin to proclaim that though it is bad and not what was promised, it would have been worse. It is the worst example of sloppy “science” imaginable, where the theory is entirely unfalsifiable. Perhaps there is comfort in human nature ignoring repeated attempts at conjuring illusions. In other words, eventually the boy who cried growth will be ignored and then maybe we can actually try something else.
No comments:
Post a Comment