By: Garry_Abeshouse
Bulls--t and criminality back in 1970 was much the same as bulls--t and criminality now.
January 2014 marked the 44th anniversary of one of the biggest mistakes of my life. Back in January 1970, I was young and inexperienced as to how stock markets functioned and balked at selling on the huge profit I was making at the time. The Australian speculative boom in nickel stocks was peaking and everyone around me was saying it was going to last forever. Even the solicitor I was using at the time told me to hold on, while unbeknown to me, he was actually dumping huge quantities of one of the stocks I was holding. This was in the middle of a huge feeding frenzy of disinformation that makes up a large part of every bull trap that has ever existed. But then as now the market tone was and is changing, from one where greed and overoptimism dominate, to one where fear again regains ascendance. Bull traps have forever been defined in these terms.
As in 2008, the combination of Murdoch domination and time poor journalists ever fearful for their jobs are letting us down, as they pursue the peripheral 24 hour news cycle as an easy way out of analysing and reporting the in depth news of the year or decade. Financial economists, uncomfortable with socio-economic issues, still treating people as merely impediments to “efficient” and “free” markets – have now been increasingly discredited by the likes of Naomi Klein, Matt Taibbi and “new age” economists such as Bichler and Nitzan. But reading or listening to the mainstream media, you would never know. The longer the financial discourse is limited to the theoretical economic constructs so beloved of the financial media, the less chance we have of limiting future collateral damage to our socio-economic wellbeing.
It’s rather ironic that much of the major exposés of abhorrent bank behaviour since 2008 have been pushed rather reluctantly into the light of day by a journalist from Rolling Stone Magazine, rather than from the mainstream media. And yet again on February 27th 2014, Matt Taibbi has exposed more “unusual activities” that these banks have been up to under the by-line of “The Vampire Squid Strikes Again: The Mega Banks' Most Devious Scam Yet”. Go to the Rolling Stone Magazine website and read it in mind boggling detail and weep.
But what is more incredible than the article itself, is the TOTAL lack of follow through by the rest of the world’s media after the initial publishing.
Vladimir Putin: We should be more than a little concerned.
At the time of writing, it appears that Vladimir Putin and his all too apparent bully boys, may have won the battle for the Crimea, as could well be construed to be his historical right. But money talks as they say and it just may be that Putin was too slow in his socioeconomic reforms and a little too overzealous in his personal ambition of re-establishing Russian prominence in the world political order.
As Alexandr Dugin, from Moscow State University recently wrote on Ft.com: Putin’s reign “has been moulded from inside by the desertion of the middle class from the ranks of his supporters and the growth of a liberal protest movement. . . . He will pursue the national interest, regional and global power, protectionism and mercantilism. Having lost the cold war, Russia will try to revise the status quo using all available opportunities.” Whatever the outcome, the winner of course will be the Vodka manufacturers.
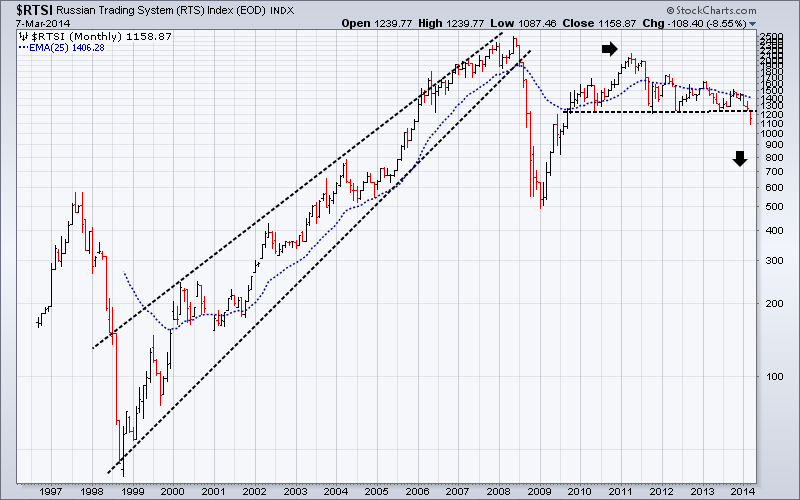
As Putin should know, destruction of the social compact of any nation never happens overnight. It takes generations of intentional neglect for this to happen, hence the ancient Chinese saying of how "the portals of the rich reek of flesh and wine, while frozen bodies by the roadside lie". Long market tops have a habit of allowing ugly truths of greed and socioeconomic bastardry to lie in the shadows far longer than they should; coming to light only when the bull trap is sprung, panic sets in and a “Dragon King” is born. Putin may indeed have won the battle for Crimea, but he may just end up losing the aftermath, if the following chart of the Russian RTS Index has any significance at all.
Industrial Metals Spot prices, BHP, Emerging Markets and China.
Large mineral exporters such as Australia, Canada, Brazil and others, should really be seen as early reactors to the global economic slowdown. This is quite separate to the froth and bubble associated with Wall Street and their media and blogger hangers on. The performance of large mining companies is linked strongly to the changing perceptions of China’s immediate future, while in turn China’s future is linked to the economic health of the more affluent consuming nations, which in turn are cutting back their consumption as any meaningful return to rising job numbers fails to materialise. Falling birth rates and rising unemployment around the world are not generally conducive to rising import of raw materials to China or exports from China.
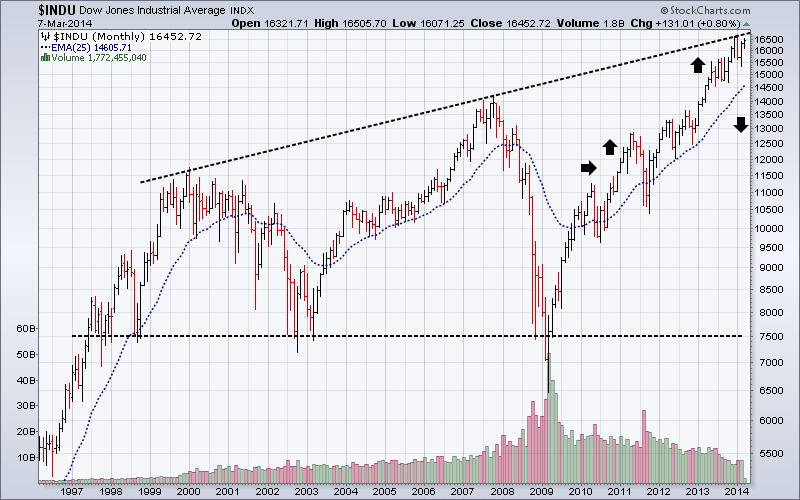
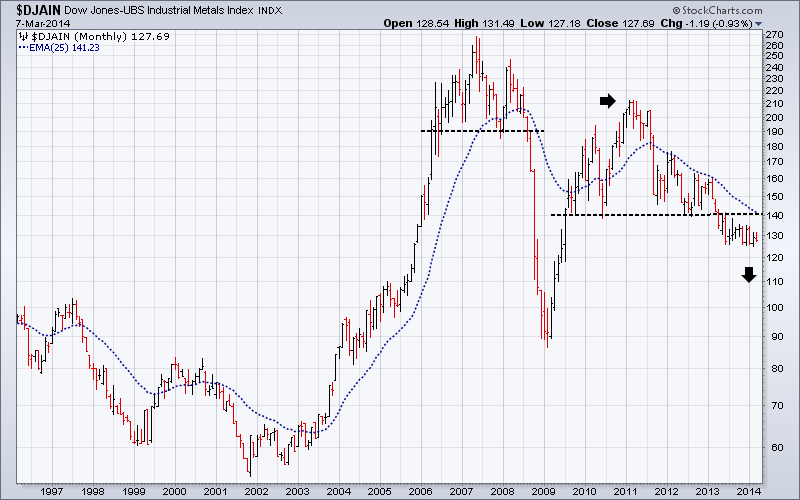
The sequential topping out of financial markets continues as expected. The DJ-UBS Industrial metals Index has already broken down from a top even larger than the one in 2006/2008. Further falls in metal prices would effectively reconfirm the current bear market that commenced in early 2011, as can be seen in all the charts below, confounding the optimists as day traders push up the Dow (see the above monthly chart).
Australia, as a major mineral exporting nation to China, has a very thinly traded equity market by NYSE standards. This enables Indices and stocks to be easily manipulated by the major traders, which in this case would be mainly hedge funds and super funds owned by the major insurance companies and banks. Highest volume comes from just a handful of stocks dominated by the big four banks, BHP and a few others.
By comparison, the average monthly number of equity shares traded over the last twelve months on the entire ASX is around 15.75 million shares compared to the 1.5 billion shares traded just for EEM.
This means that the whole of the Australian equity market as reported by the ASX, is only about 1% of the EEM ETF volume.
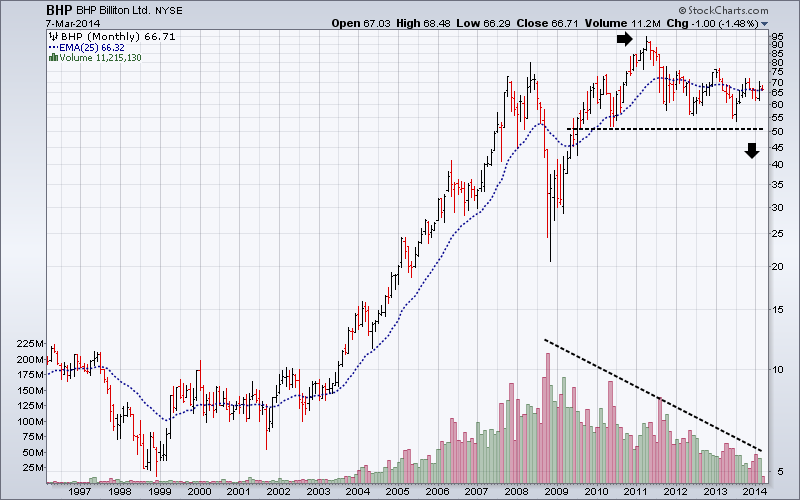
BHP has always been a market leader and is showing signs of being at the tail end of a 4 year old classic Head & Shoulders top, distinguished by its declining volume over the same period of time. This can be seen in many other equities as well. Should this be the case, then similar patterns found in other key charts would certainly follow into a resurgence of the major bear market, when the BHP price falls below $50.00. BHP as a market leader would also be a key bear market indicator.
The following four charts and what they represent are inexorably linked to the historical global socio-economic slowdown we are now experiencing. What all the monthly charts here (except the Dow) have in common, is that they have each formed a major peak in the first half of 2011, which in effect saw the beginning of a new sequential topping out of financial markets across the world. Fighting this trend into a new major Bear Market of course, has been the weak recovery of the US economy and the unfettered flood of cheap money moving via the banks into high end real estate, selected equities and on and off balance sheet derivatives at historically record volumes, based on who knows what going to who knows where. See the BIS statistics below.
Compare for instance the Russian and US Equity markets to the financial markets illustrated below and you will see a distinct divergence since the first half of 2011. It is totally inexplicable that over future months we could have any extended improvement in the world economy without a profound change in sentiment shown in these markets.
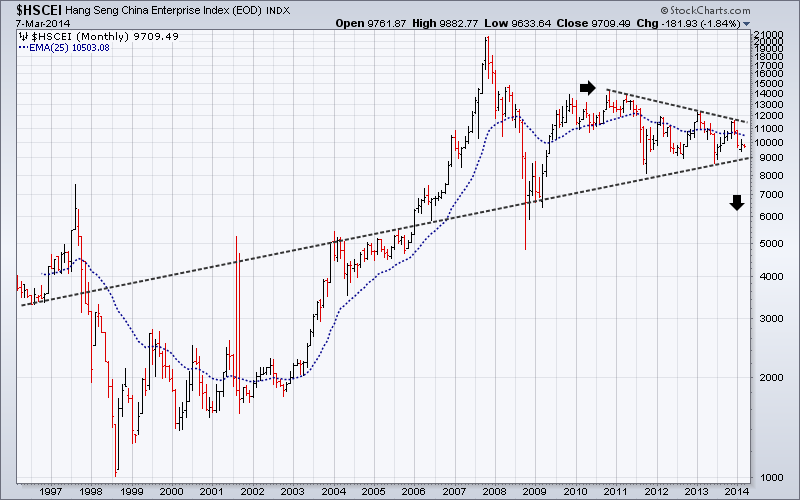
Note that the Hang Seng China Enterprises Index (“H-shares Index") is a major index that tracks the performance of China enterprises listed in Hong Kong in the form of H shares and is dominated by Financial stocks (62%) and Energy stocks (20%), making it an excellent lead indicator for Chinese equities. On the other hand I would expect high profile technology stocks, such as Baidu to lag.
Emerging Markets
In May 2013, ING (as quoted in the WSJ) estimated that “The total indebtedness of the world, including all parts of the public and private sectors, amounted to $223.3 trillion or 313% of global gross domestic product.” And “that debt in developed economies amounted to $157 trillion, or 376% of GDP. Emerging-market debt totalled $66.3 trillion at the end of last year, or 224% of GDP.” 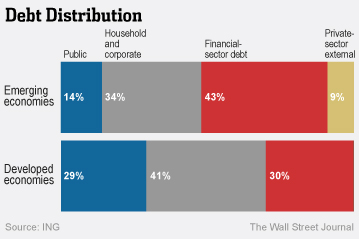
ING further commented that “Debt can become dirty when the rise of debt service costs exceeds income and a borrower’s long-term ability to make payments and often when rapid growth of debt and/or lack of adequate transparency disguises creditworthiness issues.” With the currencies from BRIC and developing nations looking increasingly shaky and the USD underpinned by a comparatively stronger economy, the scenario I painted back in June last year concerning the USD debt payments of debtor nations looks to be well on track.
The EEM ETF was developed as an equity benchmark for emerging markets stock performance. As you can see below it turns over roughly between 1 and 2 billion shares per month. It is has the second highest turnover of all the ETF’s listed on the NYSE (the first being SPY (S&P500 ETF), which averages 2 billion plus per month). The top 10 stock holdings have only a 16.6% weighting, while China, South Korea, Brazil and Taiwan have a combined weighting of 57.4%. The ETF covers stocks from 24 countries. As of September 30th 2013, EEM had a net asset backing of $41.44 billion and a P/E ratio of 18.1. By way of comparison, the current Shiller P/E Ratio for the US S&P 500 Index is 24.99. This combination of factors makes it one of the most important and influential indexes to watch. 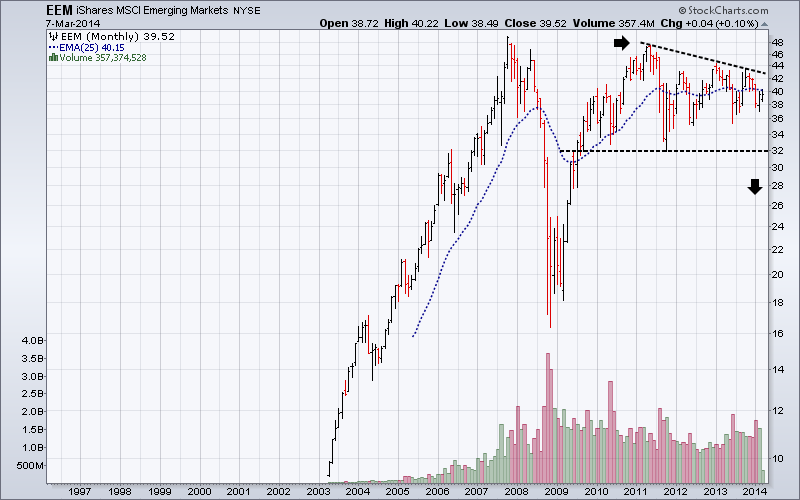
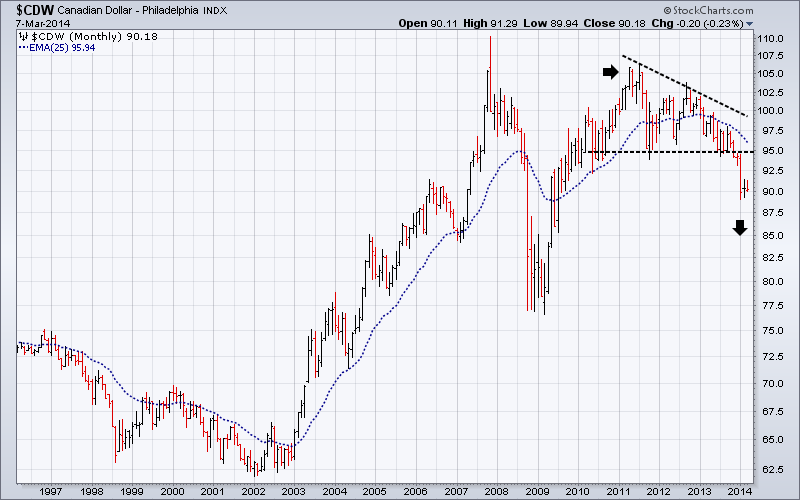
The Euro/USD and the Canadian Dollar
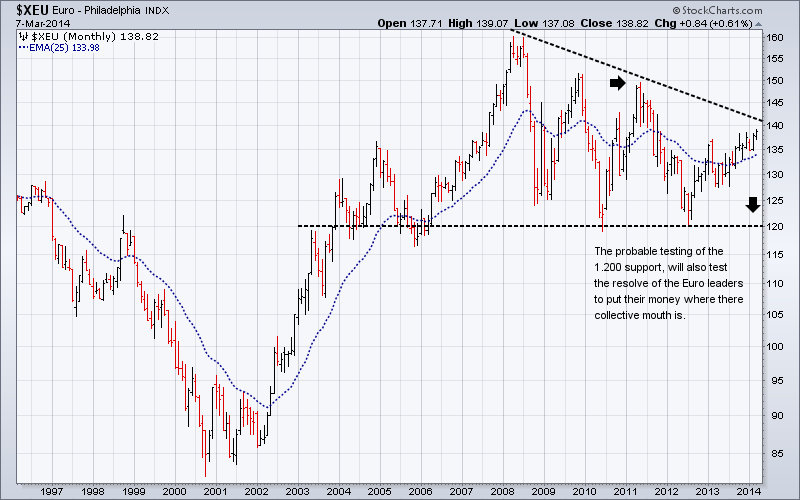
Given that the USD Trade Weighted Average is still in a long term base, the most likely scenario for the Euro will be the confirmation of a 10 year top at some future time. When the “Dragon King” type crunch does arrive, the most likely triggers will be rising unemployment and social unrest destabilising already fragile national political systems. The associated financial crises will be merely the facilitators of the economic meltdown. They will pay the ultimate price for living in a virtual world for far too long, as they find themselves haunted by the unexpected consequences of “free market economics” and unfettered globalisation.
One potential game changer over the coming months will be the German reaction to the testing of the 1.200 support of the Euro against the USD. If or when this happens, there will be a huge amount of pressure on Germany to agree to unleashing the money supply in some way in a desperate attempt to reflate the European economy as the United States has done. I expect the pressure to do this at some future time will be huge, the potential repercussions largely unknown and will depend on the “dramatic” circumstances at the time.
George Soros, in a major piece published on Caixin Online, commenting on the Ukraine, said in part, “I hope and trust that Europe under German leadership will rise to the occasion. I have been arguing for several years that Germany should accept the responsibilities and liabilities of its dominant position in Europe. Today, Ukraine needs a modern-day equivalent of the Marshall Plan, by which the United States helped to reconstruct Europe after World War II. Germany ought to play the same role today as the United States did then.” If so, who will be next, and the next and the next . . . .
The Canadian Dollar, the Brazilian Real and the Australian dollar have already broken down from 3 to 4 year tops and look set to drop substantially further. It is no accident these three currencies look similar to many of the above charts, as they represent countries with a major stake in global mining and the export of industrial metals, and as such should be considered as “canaries in the proverbial coal mine”. These three currencies have already broken through their individual supports, in a similar way to the Canadian Dollar chart below, confirming the global economic slowdown is showing no sign of ending soon. In other words, these “canaries” have already tweeted their warning, but is anyone listening? All these currencies falling against the USD, will further strengthen and consolidate the USD’s long term base.
National economies and financial markets have been peaking sequentially for many years.
It “Bears” repeating what I said back in June last year about the sequential topping out of equity markets.
“Global GDP has certainly peaked. Gold, Silver and Industrial metal prices have also peaked. Most currencies have peaked against the USD. Equity markets have been sequentially peaking over the last 13 years or more, but have yet to utter the final gasp of the economic endgame. Although the large number of index and stock price failures now apparent on charts, does suggest this time is edging closer. And lastly oil is only up where it is because the major oil companies want to keep the retail price as high as possible as long as possible and stuff the consumers.
Currency markets, skittish in the increasingly risk averse conditions are falling against the USD in rapid succession in a race to be more competitive in a world, where overall consumption is declining, long term unemployment is going through the roof and large corporations like BHP and Rio are preparing for the perceived lean years ahead.
The over concentration of media attention on a small number of US composite indices such as the Dow 30 industrials and the S&P 500 Large Cap index has both distorted and underplayed many underlying weaknesses in equity markets across the world. Some people inside the borders of the USA may think they are still the centre of the universe, but there are many others elsewhere, who would disagree. If you are like me and accept that equities are in a multiyear top, it becomes far more logical to accept that equities will top out sequentially over time rather than all at once. If you check a range of long term charts, you will see that this has indeed been the case.”
The charts above have behind them stories of greed and false hopes, but what they all have in common (excluding $RTSI and $INDU) is that they are all lower now than their 2011 peaks. What continues to be ignored is the lack of “blue sky” in key indices and stocks as they continue to hover above their 2008 highs.
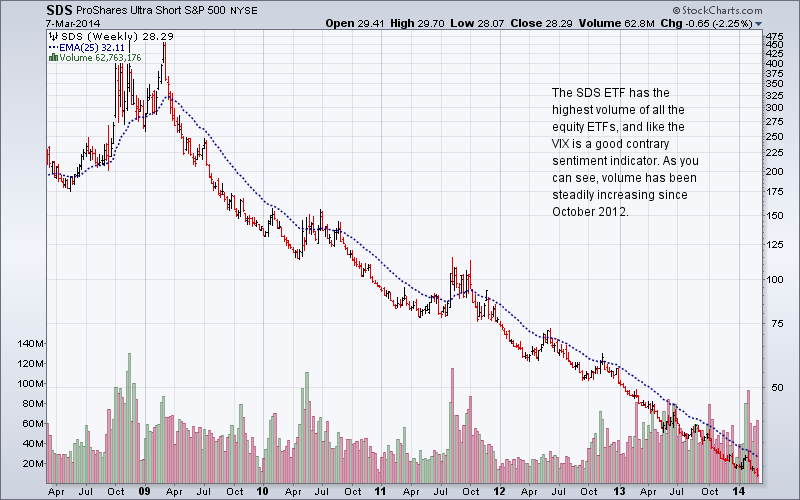
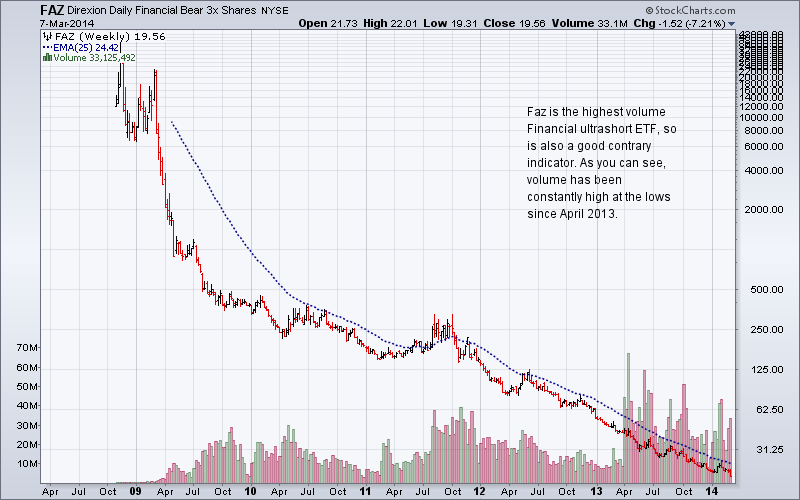
Short term charts also suggest that despite recent new highs in key US indices, sentiment is definitely turning towards the Bear.
Here are three of the best. 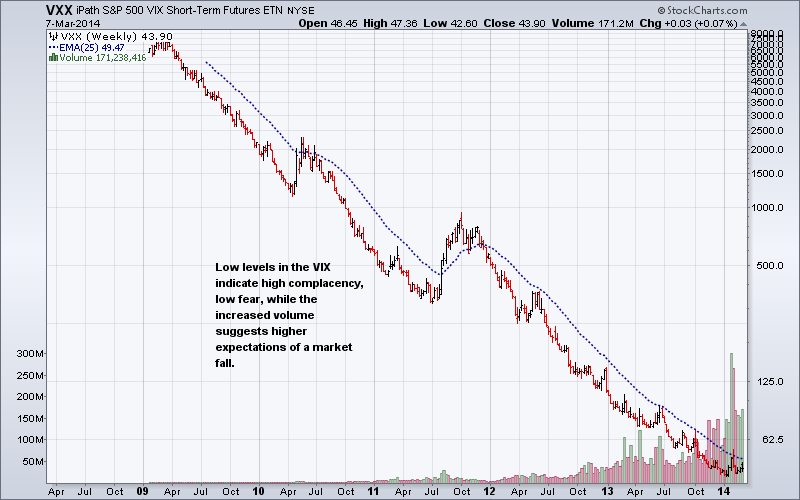
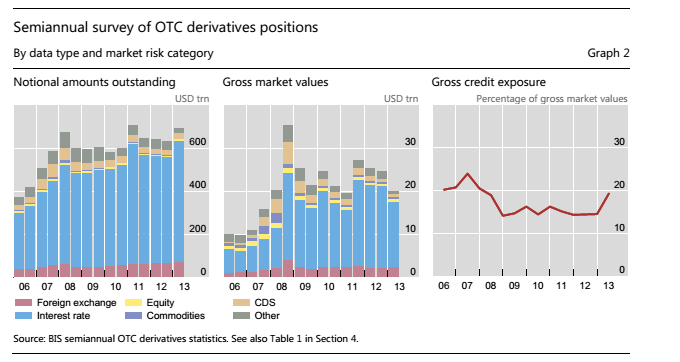
BIS statistics show that Notational Amounts of Derivatives outstanding have continued to grow over the last 5 years.
These figure should be compared with the most recent estimates from the BIS, which showed “that notional amounts outstanding totalled $693 trillion at end-June 2013”, and that “Gross credit exposures – gross market values after legally enforceable bilateral netting but before collateral – stood at $3.9 trillion at end-June 2013.” This $693 trillion figure is now about 10 times the most recent world GDP amount of $72 trillion and still does not take into account off-balance sheet amounts. If we add those to the BIS figure it would easily take the total over the 1 quadrillion mark.
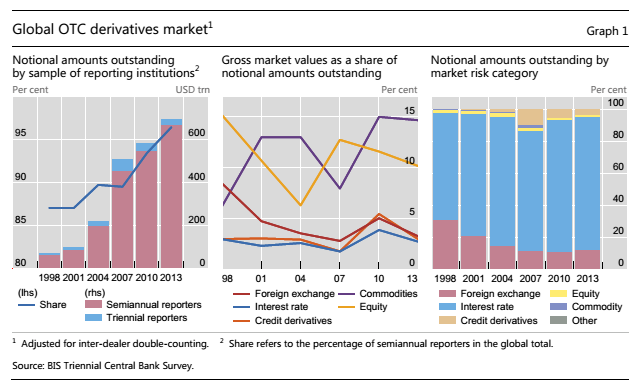
“Gross credit exposures – gross market values after legally enforceable bilateral netting but before
collateral – are collected only in the semi-annual survey. They jumped by 8% between end-December 2012
and end-June 2013 to $3.9 trillion. Relative to gross market values, exposures rose from 15% to 19%,
which was the highest percentage reached since end-2007 (Graph 2, right-hand panel).”
Key financial and economic data are out of sync with reality.
There is a certain disconnect between this graph on the level of corporate profits: 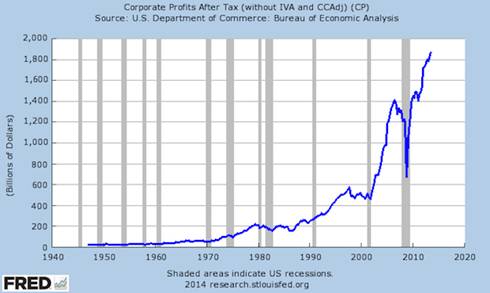
And this one: 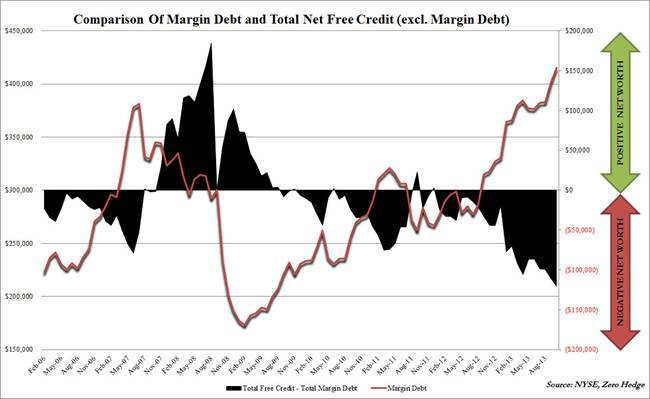
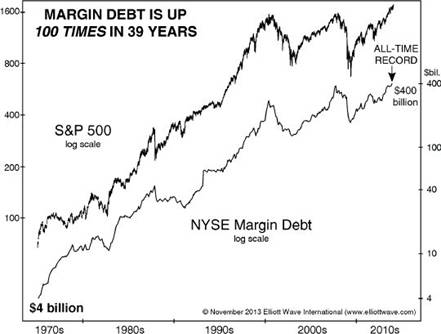
“Relative to the NYSE Composite, this is the most “leveraged’ investors have been since the absolute peak in Feb 2000. What is more worrisome, or perhaps not, is the ongoing collapse in investor net worth - defined as total free credit in margin accounts less total margin debt – which has hit what appears to be all-time lows (i.e. there’s less left than ever before) which as we noted previously raised a “red flag” with Deutsche Bank. Relative to the ‘economy’ margin debt has only been higher at the very peak in 2000 and 2007 and was never sustained at this level for more than 2 months.”
(Graph from Feb. 2006 and Comment courtesy of STA Wealth)
And this one courtesy of Elliott Wave International, putting margin debt in historical context:
Muddying the waters of truth and justice will be the American way over the next 8 months.
As if it was ever any different. Between now and the November 4th elections in the USA, you may expect an ascendency of spin, the likes of which have never been seen before, because from the Obama’s governments perspective, the stakes have never been so high as they try and get rid of the Tea Party electorally once and for all. The US Fed and its leaders are past masters of the art of spinning to emotional financial markets operating on hair triggers in a low volume environment. A pliable and superficial financial media more interested in the day’s headlines than what lies underneath, just makes it that much easier. The world’s shadow financial system is now so huge and complex; it has become like a ship the size of a planet with no one at the helm. The hedge funds desperate for short term profits wherever they can get them have become more amiable to risk taking than ever before, as seen by the record levels of margin debt.
Watching the day to day currency movements you can easily see how emotional these markets have become. The US Fed can tweak financial markets whichever way they want, just by rumour mongering at certain times of the trading calendar, especially when option and futures prices are most vulnerable. For example, the recent Janet Yellen speech combined with the impending President’s Day long weekend, triggered off a huge flurry of short and long covering in financial markets, strong enough to be considered a mini Bull Market of its own. Exquisite timing wouldn’t you say? Like the annual price hikes in the UK Pound and the Euro during DAVOS in Switzerland.
At least until November 4th, Obama and the US Fed will want the USD kept low, giving them and definite export edge over other exporting nations. This could possibly be assisted by the Chinese government selling off some of their $4 trillion worth of US treasuries. This would have the dual benefit of keeping internal liquidity buoyant over the short to medium term, without printing too much paper. Certainly something to watch.
Labour intensive work is disappearing faster than new jobs are being created.
The good news on jobs is not necessarily good news on future jobs for all. Matt Wade a senior writer for the Sydney Morning Herald, explores a dilemma many countries now face. Extracts:
“Terry Rawnsley, who researches regional economies for consultancy firm SGS Economics and Planning, says businesses in the global economic corridor have proven highly competitive in global markets.
''The people working in that corridor tend to be very good at what they do,'' he says.
It has become a magnet for workers, especially the highly skilled, over the past five years. Employment growth in that corridor has been three times higher than the rest of Sydney since 2008 and about 40 per cent above the national average. Rawnsley says an extra 93,000 jobs were added in the global economic corridor between 2008 and last year, which equates to an average annual growth rate of 2.1 per cent. By comparison, average jobs growth in the rest of Sydney was just 0.7 per cent in that period and national employment grew by 1.3 per cent. Globalisation and the advance of technology have put some industries, notably manufacturing, under great pressure. But enterprises along the global economic corridor seem to have thrived on those same forces.
But the success of the global economic corridor exposes an urban paradox. Even though mobile technology has made remote communication easier than ever, the city's fast-growing knowledge industries are bunching together in fewer, more valuable locations.
Knowledge-intensive industries cluster because their workers rely heavily on face-to-face communication in order to share information, generate ideas and cut deals. These crucial knowledge ''spillovers'' also happen as firms trade and as employees move between organisations.
''These are ''thinking jobs'' rather than ''making jobs'' and those are the types of jobs where agglomeration economics really works because they are very human-centred,'' says Jane-Frances Kelly, director of the Grattan Institute's Cities Program.
Sydney is not alone - in cities across the world knowledge jobs are clustering closer together. Global economic forces are not often linked to day-to-day life in the city. But Committee for Sydney chief executive Tim Williams believes these sweeping trends are having a major impact on the way Sydney works. ''These great global forces are reshaping cities,'' he says. ''They are essentially putting the high value knowledge jobs in one place and the residential development in another place.''
The concentrated pattern of jobs creation in knowledge intensive industries reverses the much more dispersed pattern of job creation when the economy was more reliant on manufacturing. Decades of urban sprawl, influenced by the old dominance of manufacturing, has left many outer-urban communities distant from high-value jobs.
In Closing:
Look around. The precursors of future “Dragon Kings” are everywhere.
To recap from last time:
“In a paper presented to a prestigious Engineering Journal in July 2009, Didier Sornette “proposed that the true origin of a bubble and of its collapse lies in the unsustainable pace of stock market price growth based on self-reinforcing over-optimistic anticipation.”
He proposed that the eventual collapse of a market top is preceded by the accumulation of several bubbles, whose interplay and mutual reinforcement leads to an illusion of a “perpetual money machine”, allowing financial institutions to extract an increasing amount of wealth from an unsustainable and artificial process. As the speculative bubble progresses to maturity, it becomes more and more unstable and extremely sensitive to any disturbance, which in turn leads eventually to a crash. These resultant crashes or outlier events, he terms “Dragon Kings”.
“Dragon Kings” have been with us for hundreds of years, and while being terrifying when they occur, always arrive littered with history’s collateral damage. The next one will see many global corporations diminished in size, and most of the financial economists will have missed their chance of picking the Bear once again.
No comments:
Post a Comment