by Greg Harmon
The Dow Jones Industrial Average has had a hard time over the last month. In August it made a new all time high but them began a pullback. This has led to some dramatic shifts in sentiment. Ralph Acampora, the Godfather of Technical Analysis got skittish, posting early Wednesday:
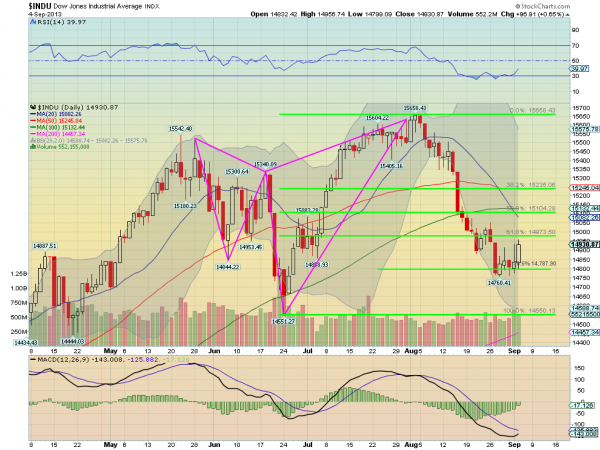
So with Wednesday’s action now in the books I am happy to point to one set of technicals that show the worst may be over. The chart below is the equivalent of a Wayne’s World Extreme Close Up for the past 4 months. The Shark Harmonic that took control has now retraced 78.6% of the full pattern and started higher out of consolidation Wednesday. It still has work to do to get healthy, and it may reverse, but if this low holds there are a lot of positives in this chart. The RSI is moving back higher is the first. When looking at the low in the RSI below the RSI low at the June 24th price low, it also gives rise a a Positive RSI Reversal which would target a new high at 15,867.57. It also has support from the MACD histogram moving back towards positive territory and the the MACD line about to cross up through the signal line. A reversal would be much more secure with a move back over 15,050 but this is a start.


No comments:
Post a Comment