by Greg Harmon
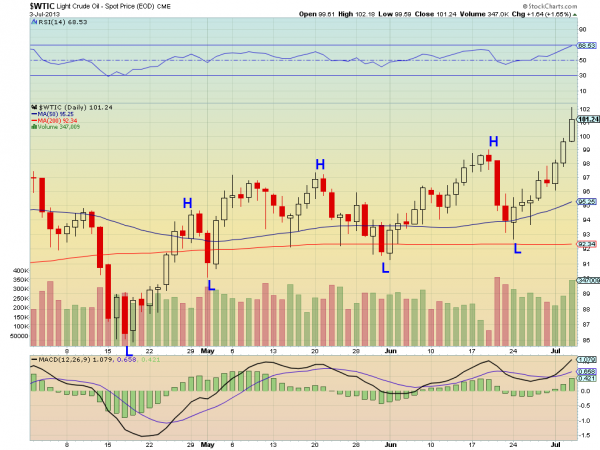
Crude Oil ($CL_F, $USO) has been moving in a broad tightening channel for months. That is about to change it seems. The daily chart below shows that it has been building for a while. A series of higher lows and higher highs has led to the break higher this week and a new higher high. The Relative Strength Index (RSI) and Moving Average Convergence Divergence indicator (MACD) both support the move continuing. So does the 3 Advancing White Soldiers Pattern.
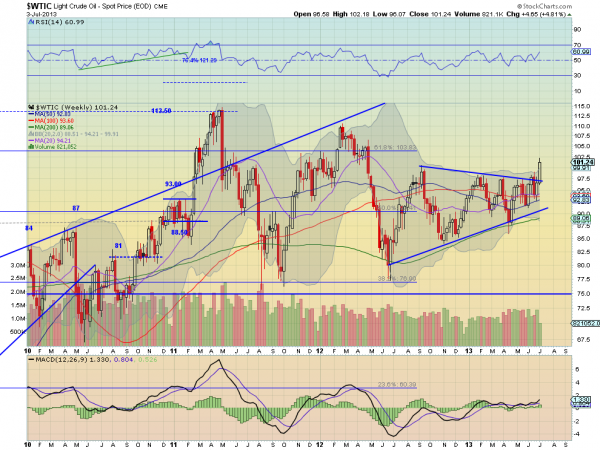
But a look out at the weekly chart below is what can get you excited. With one day to go, it is breaking a symmetrical Triangle to the upside. If it holds up Friday the target on the pattern break takes it to 117. This chart also has support for a continued move from the RSI and MACD. At that price there is nothing left in the way as resistance before the previous top at 147.


No comments:
Post a Comment