by Greg Harmon
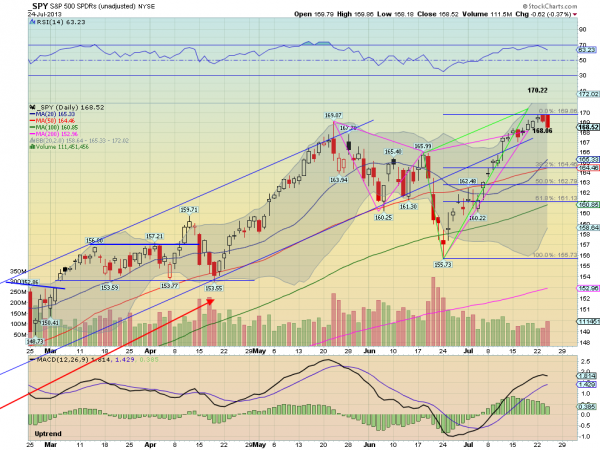
I have been a vocal bull for sometime now so this may shock you. I bought some S&P500 SPDR, $SPY, Puts yesterday. Well technically I bought Put Spreads, as I am not expecting a crash, but the chances for a pullback seem reasonable right now. The daily chart of the SPY below shows why. The SPY had been tracing out a bearish Shark pattern since making a low at 155.73. Those that follow Harmonics know that a Shark can have two points where it reverses, an 88.6% retracement of the initial leg lower or a 113% retracement of it. This initial leg is from the 169.07 high to 160.25 low, and gave targets of 168.06 and 170.22. The first target was met last week and the chance for a reversal from a high at 169.86
has been building the last few days. Starting with the Evening Star Monday, confirmed lower Tuesday and a longer red candle Wednesday, was enough for me to pull the trigger. The Harmonic has not triggered yet but it is looking more likely. And when it does the first target is a 38.2% retracement of the full pattern or the 155.73 to 169.86 range. I have added the Fibonacci’s to the chart so you can see the target at 164.46. The Second target on a continuation lower is at 161.13, the 61.8% retracement. This trade was a August 9 weekly 168/164 Put Spread for $1.00, risking $1 to make $4 if the market continues lower. A 4:1 reward to risk ratio that will play out over the next 2 and a half weeks.

No comments:
Post a Comment