Last week’s review of the macro market indicators suggested, heading into the shortened unofficial first week of Summer, that there was some nervous caution in the markets. Gold ($GLD) looked to consolidate with a downward bias while Crude Oil ($USO) churned in the tightening range. The US Dollar Index ($UUP) seemed ready for a pullback in the recent uptrend while US Treasuries ($TLT) were biased lower in their consolidation. The Shanghai Composite ($SSEC) looked strong but Emerging Markets ($EEM) were biased to the downside. Volatility ($VIX) looked to remain benign keeping the bias higher for the equity index ETF’s $SPY, $IWM and $QQQ, despite short term pullbacks and recent new highs. Their charts showed more caution with a further pullback or consolidation likely.
The week played out with Gold moving higher before sellers can back on Friday while Crude Oil moved lower in the range. The US Dollar held at resistance before failing to end the week while Treasuries broke the consolidation moving lower. The Shanghai Composite made a higher high before retreating while Emerging Markets just moved lower. Volatility picked up off of the lows but remained subdued. The Equity Index ETF’s SPY, IWM and QQQ consolidated in triangle patterns tightening into Friday and under the highs from last week. What does this mean for the coming week? Lets look at some charts.
As always you can see details of individual charts and more on my StockTwits feed and on chartly.)
SPY Daily, $SPY 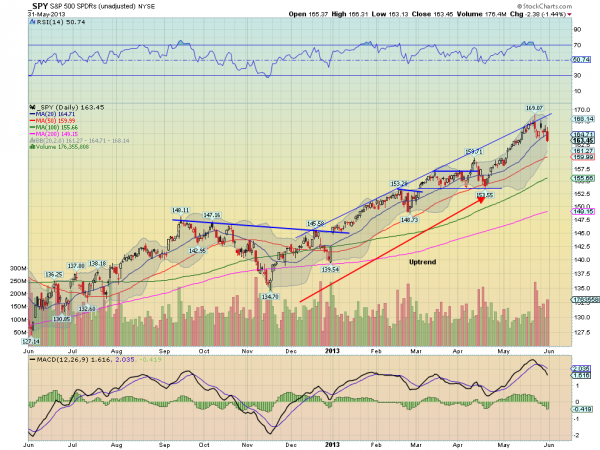
SPY Weekly, $SPY 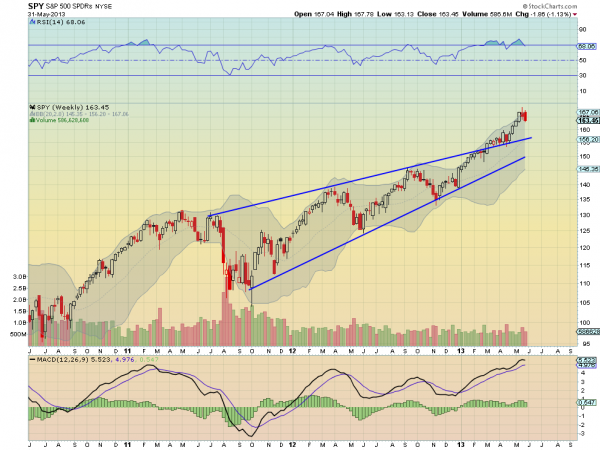
The SPY consolidated for most of the week before falling in a long red candle Friday. The fall took it through the 20 day Simple Moving Average (SMA) and into the bottom half of the Bollinger bands for the first time since April 22nd. The Relative Strength Index (RSI) on the daily chart is falling and at the mid line, a critical level between here and 40, with a Moving Average Convergence Divergence indicator (MACD) that is rolling lower on both the signal line and the histogram. This view looks like more downside. Out on the weekly front the Bearish Engulfing candle follows the Spinning Top from last week, confirming it lower. The RSI is working off a technically overbought condition with a MACD that is starting to level. There is resistance higher at 166.5 and 167.50 and support lower at 163 followed by 159.72. This looks prepared for the pullback everyone has been anticipating. Continued Downside in the Uptrend.
Heading into June the markets look ready to take a breather and perhaps pullback. Gold though is biased higher in the short term in its downtrend while Crude Oil heads toward the bottom of its range. The US Dollar Index and US Treasuries both look to continue lower. The Shanghai Composite maintains an upward bias but may consolidate first while Emerging Markets continue biased to the downside. Volatility looks to low but drifting higher keeping the long term bias higher for the equity index ETF’s SPY, IWM and QQQ, but maybe a drag in the short run. The index ETF’s themselves appear to be weakening in their uptrends with the SPY the weakest followed by the IWM and the QQQ still showing some strength in longer charts., Use this information as you prepare for the coming week and trad’em well.
No comments:
Post a Comment