by Greg Harmon
Gold has a technical relationship with many other market segments. Looking at
its relationship with US Treasuries it s now at a critical juncture. Below is a
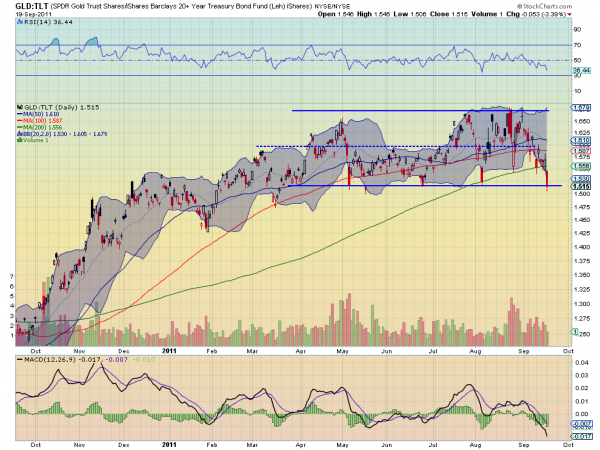
ratio chart of the SPDR Gold Trust ($GLD)
against the iShares Barclays 20+ Year Treasury Bond Fund ($TLT).
Notice how this ratio has been in a range between 1.51 and 1.67 since April. A
pretty tight correlation for this period. But now as it

approaches the bottom rail of this channel there are signs that it may crack.
First the Relative Strength Index (RSI) has been trending lower, not a sharp
move like the last time it bottomed. Next the Moving Average Convergence
Divergence (MACD) indicator has been negative for most of the move down and is
just now becoming more negative again. The volume on this move lower is much
bigger than the last test as well. Finally it closed under the 200 day Simple
Moving Average (SMA) yesterday for the first time since September 30th, just 10
days after the S&P 500 broke out of its bottoming pattern to start the move
higher. It may hold the channel and and reverse back higher, but a breakdown,
indicating a flow from Gold into US Treasuries could cause a powerful change in
the market. Be mindful.
No comments:
Post a Comment